
Figure 5.
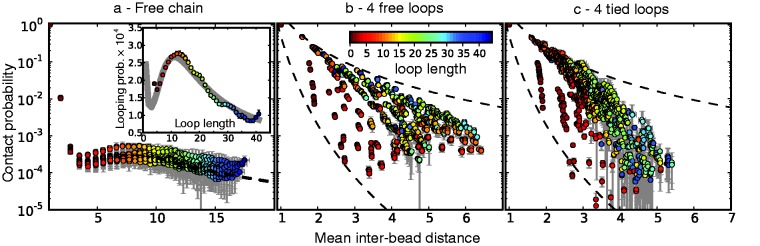
Variation of bead CPs with mean inter-bead distance in reference ensembles for chain (a) without restraints, (b) with four free loops and (c) with four tied loops. Each point represents one of the possible bead pairs in the chain. Error bars are standard deviations over 10 independent simulations. The dashed line in (a) is a fit of the power law  , giving
  . Inset in (a): looping probability versus loop length in ensemble for chain without restraints. The curve in this inset is a fit of Equation 3 from (26). The dashed curves in (b) and (c) are power laws with exponents −8 and −3. Distances are in units of
  .
.