
Figure 7.
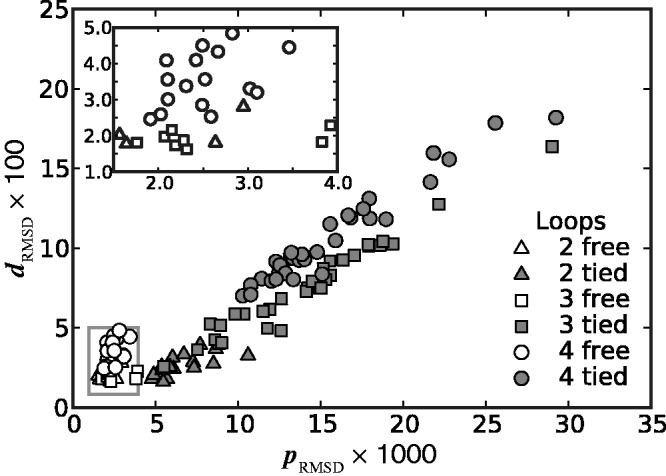
Plots of RMSD of mean inter-bead distances (Equation 17) against RMSD of CPs (Equation 15) for all trials of the ensemble recovery procedure and for all tested systems. Each point represents RMSD values obtained from an ensemble of 106 conformations at the end of a particular trial. Inset: enlarged view of boxed area. Distances are in units of  .
.