
Figure 8.
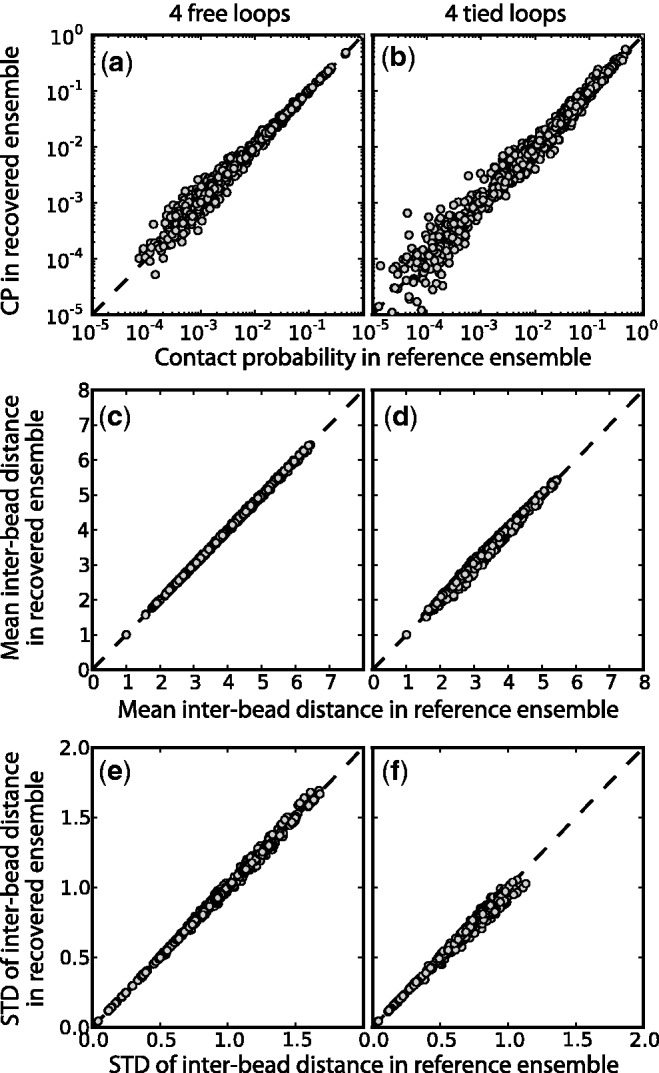
Comparison of (a,b) bead CPs, (c,d) mean inter-bead distances and (e,f) standard deviation of inter-bead distance determined from optimal recovered ensemble to respective quantities determined from reference ensemble for a chain with 45 beads and (a,c,e) 4 free loops or (b,d,f) 4 tied loops. Each point represents one of the possible bead pairs in the chain. The dashed lines are plots of y = x, not linear fits. Distances are in units of  . Better correlations were observed for test systems with three and two loops (data not shown).