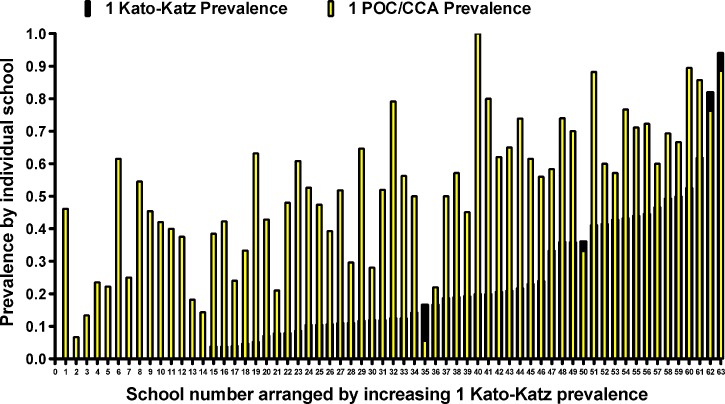
Figure 1.
Range and variation of Schistosoma mansoni prevalence of infection in 63 participant schools. Dark bars indicate prevalence as determined by standard Kato-Katz microscopy of the first daily stool specimen; superimposed light bars indicate prevalence measured using concurrent point-of-care circulating cathodic antigen (POC-CCA) detection in the first urine specimen. Bars are arranged in order of ascending prevalence based on the Kato-Katz results.

