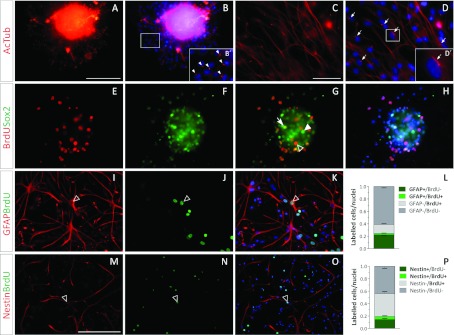
Figure 3. NPC markers in SVZ-derived NS cultures.

(A–D) Acetylated tubulin (red) in whole NS (A, B) and in dissociated NS cultures (C, D). The insets in (B) and (D) are shown at a higher magnification in (B′) and (D′) respectively. Acetylated tubulin+ cilia are indicated with arrowheads in (B′) and with arrows in (D). (E–H) BrdU incorporation is shown in red and Sox2 expression is shown in green. (G) A BrdU and Sox2 double-labelled nucleus is indicated with an arrow, while Sox2+/BrdU− and Sox2−/Brdu+ nuclei are indicated with a filled arrowhead and an empty arrowhead respectively. Images (E) and (F) are merged with the corresponding Hoechst-stained nuclei image in (H). (I–K) GFAP+ immunostained filaments are shown in red and BrdU+ nuclei are shown in green. The proportions of GFAP and BrdU-labelled cells were quantified and are shown in (L). (M–O) Nestin+ immunostained filaments are shown in red and BrdU+ nuclei are shown in green. The proportions of Nestin and BrdU-labelled cells were quantified and are shown in (P). The empty arrowheads in (I)–(K) and (M–O), indicate a GFAP+/BrdU+ and a Nestin+/BrdU+ cell respectively. The blue colour in the images belongs to the Hoechst nuclear dye. The scale bar in (A) represents 100 μm in (A), (B), (E)–(K), the scale bar in (C) represents 250 μm for (C), (D), and the scale bar in (M) equals 200 μm in (M–O). The bars in graphs (L) and (P) represent means±S.E.M. for each cell population.
