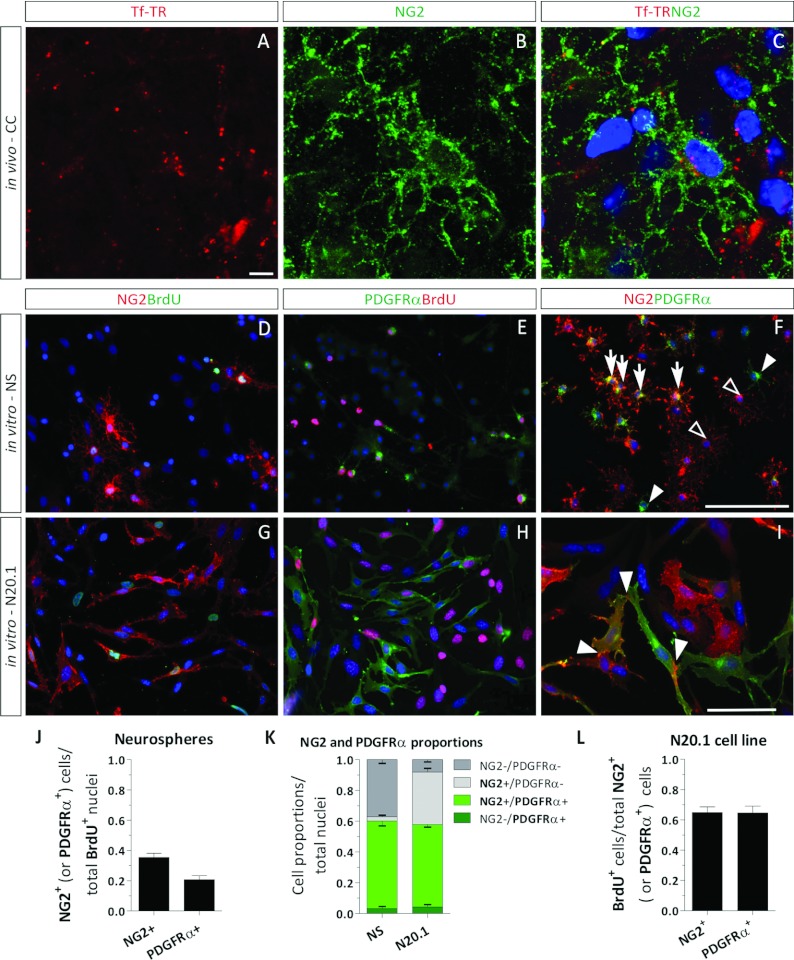
Figure 6. NG2 and PDGFR expression in the SVZ and in different culture systems.
(A–C) Confocal images of an NG2 (green) cell that incorporates Tf-TR (red) in the CC of a neonatal rat brain section after a 4 h Tf-TR injection. (D, E) Immunocytochemical analysis of NG2, PDGFRα and BrdU-labelled cells in dissociated NS cultures. (G–I) Immunocytochemical analysis of NG2, PDGFRα and BrdU-labelled cells in the N20.1 cell line. (D, G) NG2+ and BrdU+ cells are labelled in red and green respectively. (E, H) PDGFRα+ and BrdU+ cells are labelled in green and red respectively. (F, I) NG2+ and PDGFRα+ cells are labelled in red and green respectively. (F) NG2/PDGFRα double-labelled cells are indicated with arrows, NG2+/PDGFRα− cells are indicated with empty arrowheads, and NG2−/PDGFRα+ cells are indicated with filled arrowheads. (I) Areas with strong NG2 expression are indicated with white arrowheads. (J) Proportions of BrdU+ nuclei that express either NG2 or PDGFRα in dissociated NS cells after a 24 h BrdU pulse. (H) Cell proportions in NS and N20.1 cells that express either NG2 (light grey boxes), PDGFRα (dark green boxes) or both markers (light green boxes). (I) Proliferation rates of NG2+ and PDGFRα+ cell populations in the N20.1 cell line after a 4 h BrdU pulse. Scale bar in (A) equals 5 μm in (A–C), scale bar (F) equals 100 μm in (D–F), and scale bar in (I) equals 50 μm in (G–I).

