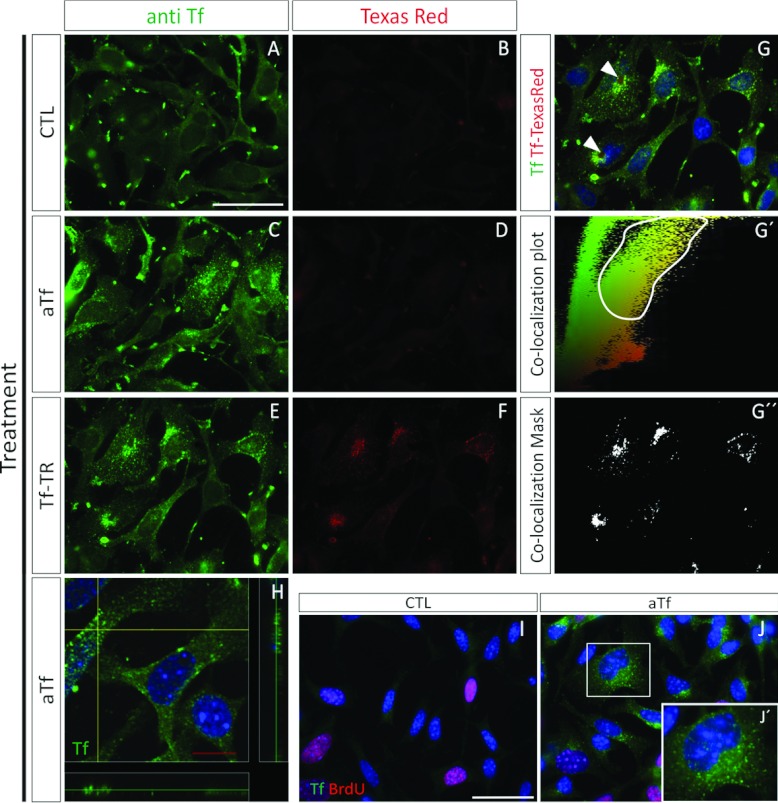
Figure 8. Tf incorporation in the N20.1 cell line.
Tf immunodetection is labelled in green, and Tf-TR fluorescence is labelled in red. (A, B) Images of cell cultures grown for 2 days in the absence of added aTf and Tf-TR. (C, D) Images corresponding to cell cultures grown in the presence of aTf (100 μg/ml) after a 2-day treatment. (E–G) Cell cultures treated for 4 h with Tf-TR. (G′) Co-localization plots of the merged image (G), where the green fluorescence intensity of pixels is plotted as a function of their red intensity. (G″) The co-localization mask determined according to the selected area in (G′), was used on (G). The white plotted area in (G″) corresponds to the double-labelled (green-red) pixels in (G). (H) Confocal image of the Tf immunodetection (green) in aTf-treated cells. (I, J) BrdU incorporation (red) and Tf immunodetection (green) in the absence (CTL) or the presence (aTf) of aTf in the culture medium. Inset in (J) is shown in (J′) at a higher magnification. The blue colour in the images corresponds to the Hoechst nuclear dye. Scale bar in (A) represents 100 μm for (A–F), scale bar in (H) represents 10 μm, and scale bar in (I) represents 50 μm in (I) and (J).

