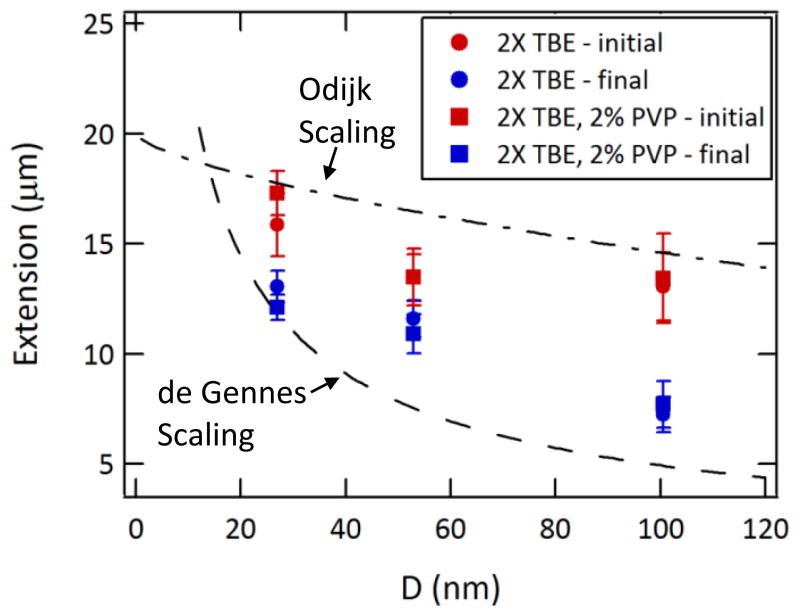
Figure 4.
Extension lengths as determined from the fluorescence images. The initial lengths describe the average lengths immediately after the DNA molecules have been pulled completely into the nanochannels. The final lengths are measured near the end of the nanochannels, before ejection into the microchannel. These dynamic values are compared to the equilibrium values predicted by the de Gennes (dashed line) and Odijk (dashed-dotted line) theories. N=10–20 molecules analyzed for each device and buffer.

