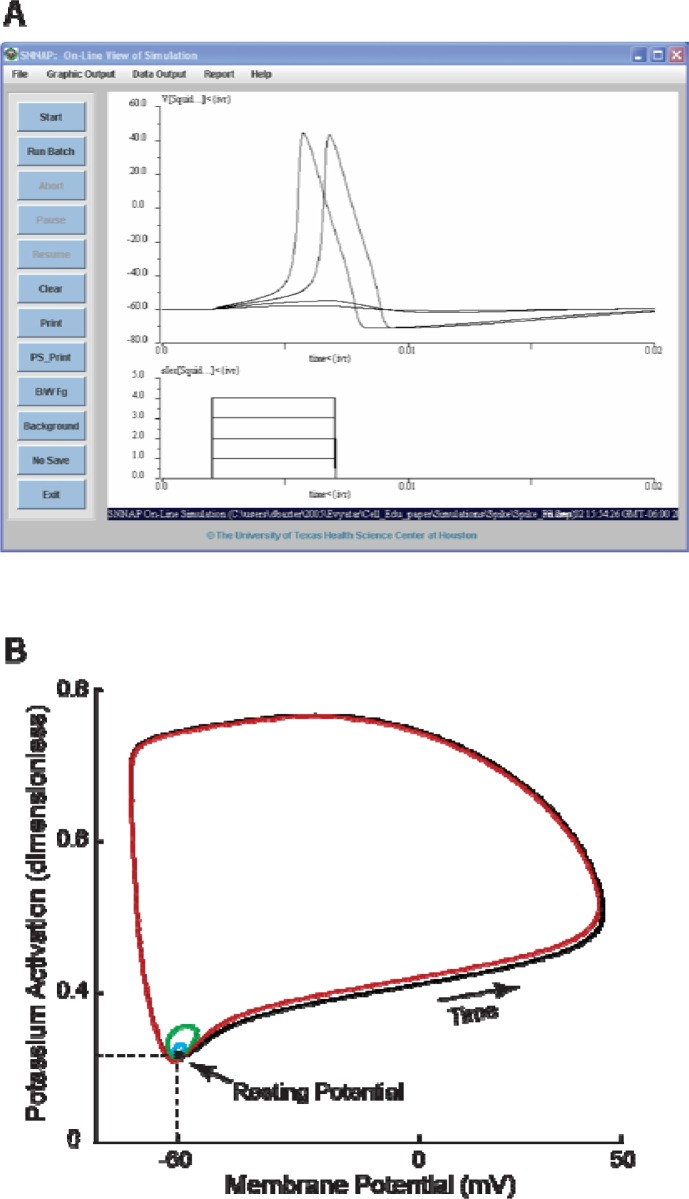
Figure 3.
Action potentials and threshold phenomena. A: Screen shot of the SNNAP simulation window. The upper trace illustrates the membrane potential of the HH model. The lower trace illustrates the extrinsic stimulus currents that were injected into the cell during the simulations. With each simulation, the magnitude of the stimulus is systematically increased in 1 nA increments. The first two stimuli are subthreshold, but the final two stimuli are suprathreshold and elicit action potentials. This figure also illustrates several features of the SNNAP simulation window. To run a simulation, first select File, which invokes a drop-down list of options. From this list select the option Load Simulation, which invokes a file manager (not shown). The file manager is used to select the desired simulation (*.smu file). Once the simulation has been loaded, pressing the Start button begins the numerical integration of the model and the display of the results. See the SNNAP Tutorial Manual for more details. B: Phase-plane representation of the threshold phenomena. The data in Panel A are plotted as time series (i.e., Vm versus time). Alternatively, the data can be plotted on a phase plane (i.e., potassium activation, n, versus membrane potential, Vm). Although time is not explicitly included in the phase plane, the temporal evolution of the variables proceeds in a counter-clockwise direction (arrow). The resting membrane potential is represented by a stable fixed point (filled circle at the intersection of the two dashed lines). The stimuli displace the system from the fixed point. If the perturbations are small, the system returns to the fixed point (small blue and green loops). However, for sufficiently large perturbations, the system is forced beyond a threshold and the trajectory travels in a wide loop before returning to the stable fixed point (red and black loops). The system is said to be excitable because it always returns to the globally stable fixed point of the resting potential. For more details concerning the application of phase plane analyses to computation models of neural function see Baxter et al. (2004), Canavier et al. (2005), or Rinzel and Ermentrout (1998).

