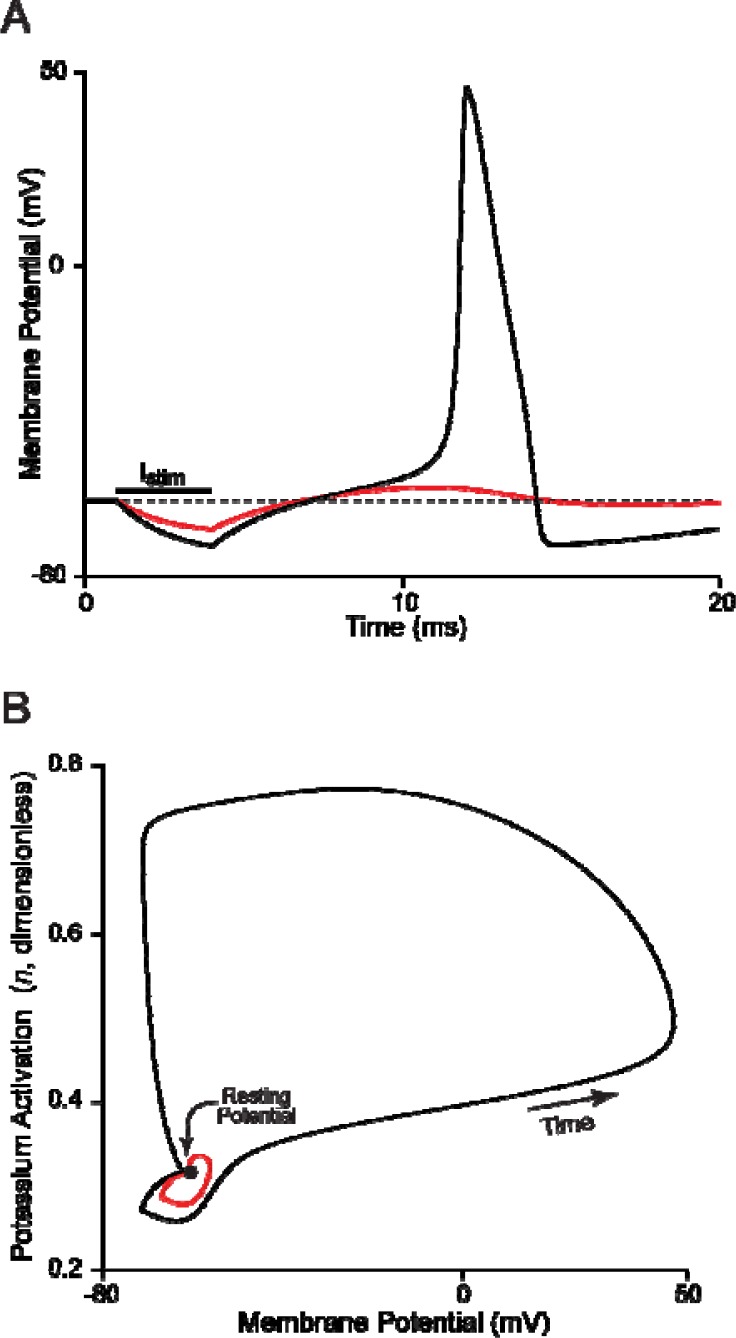
Figure 6.
Postinhibitory rebound excitation. A: Response of the HH model to hyperpolarizing current (Istim) injected into the cell. Weak hyperpolarizing current (red curve), strong hyperpolarizing current (black curve). Following these inhibitory inputs, the membrane potential returns toward rest. The recovery of the membrane potential, however, overshoots the original resting membrane and depolarizes the cell. With sufficiently large hyperpolarization, the rebound potential surpasses the threshold and an action potential is elicited. B: The simulations illustrated in Panel A are replotted in the Vm-n phase plane. The hyperpolarizations are represented by hyperpolarizing displacements of the membrane potential and decreases in the value of potassium activation. Following the hyperpolarizing stimulus, the trajectory moves back toward the resting potential, which is represented by a fixed point (filled circle). However, the trajectory that follows the larger hyperpolarization crosses a threshold (also referred to as a separatrix) and an action potential is generated.

