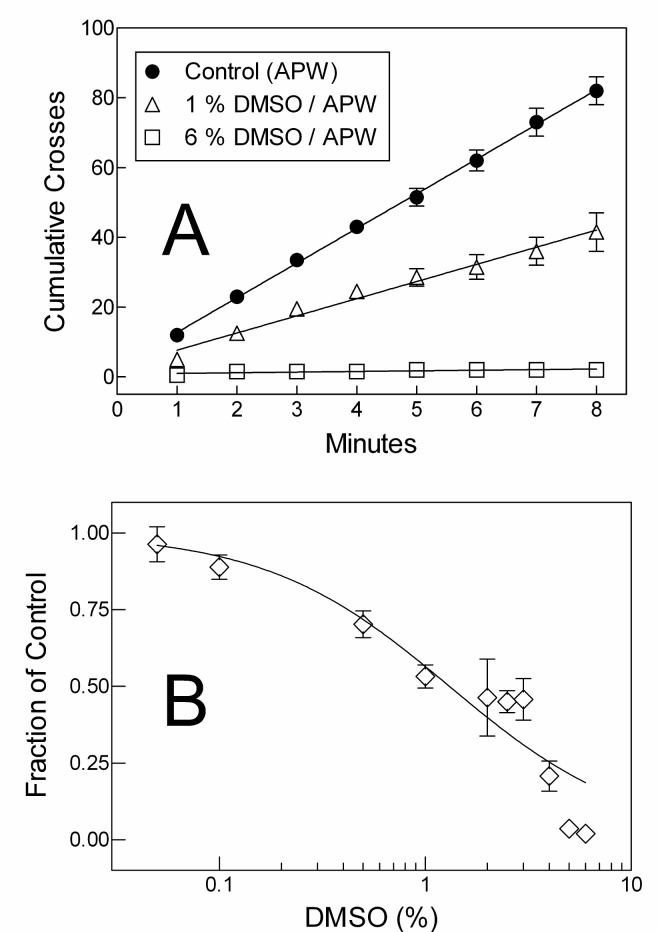
Figure 4.
A. Representative linear plots showing planarian motility decrease by two DMSO concentrations. The lines were generated by fitting the data to a linear equation. B. The experimental slopes were normalized to control slopes (APW) and graphed as a function of the DMSO concentration. The line was generated by fitting the data to Equation 1 (see methods). Each curve represents a minimum of three experiments. Error bars represent the standard error of the mean.

