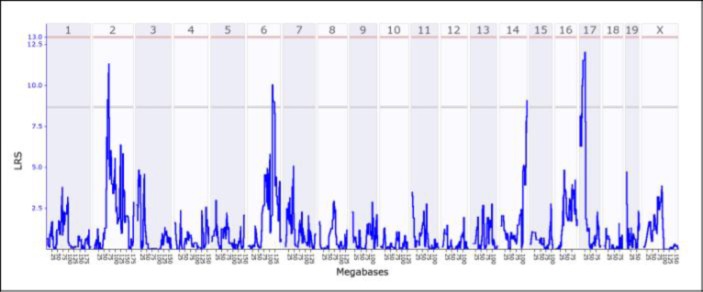
Figure 3.

Output from WebQTL of the QTL analysis showing the Likelihood Ratio Statistic as a function of markers across chromosomes 1–19 and X. In this term, students found suggested peaks on chromosomes 2, 6, 14, and 17, which suggests that genes that affected the phenotype are to be found in the regions of chromosomes corresponding to the peaks. [Source: http://www.genenetwork.org/]
