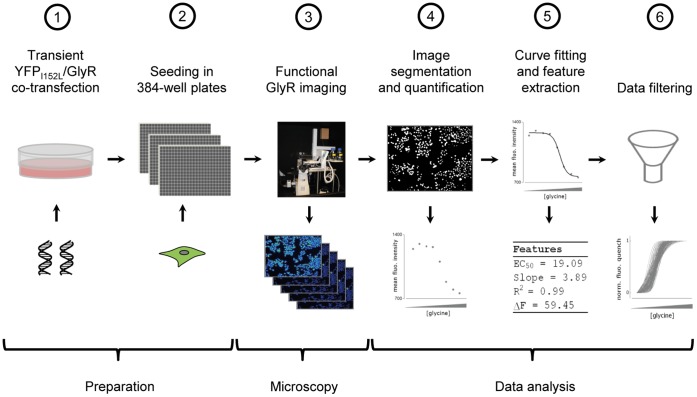
Figure 1. Work flow of experiment and data analysis.
HEK293 cells were transiently co-transfected with YFPI152L and GlyR cDNA ( ). Approximately 48 h later, cells were seeded into the wells of 384-well plates at defined density and are cultured for another 24 h (
 ). Functional analysis of GlyRs is carried out by progressive receptor activation and iterative fluorescence imaging using an in house-built automated screening device with integrated liquid-handling robotics (
 ). Recorded images are segmented and fluorescence dose-responses calculated (
 ) are fitted (
 ). Finally, functional parameters measured in single cells, such as R2, ΔF, slope and EC50 are filtered to discriminate functional from non-functional data (
 ).
).

