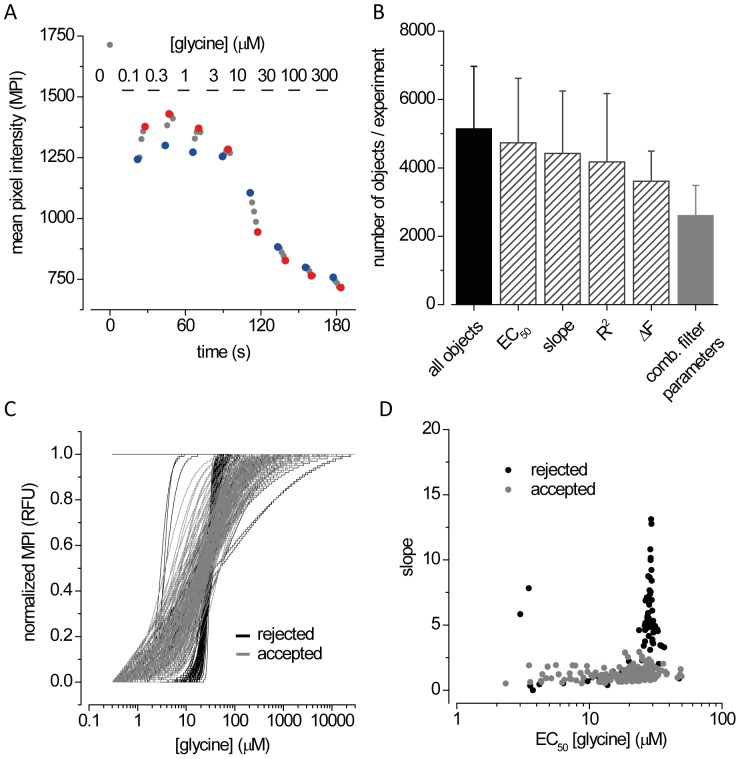
Figure 2. Development of the assay for single cell-based functional imaging.
A. Determination of optimal assay conditions. HEK293 cells YFPI152L and α1 GlyRs were seeded into 384-well plates. The culture medium was replaced by 20 µl control NaCl solution and cells were imaged once to record cellular fluorescence in unquenched state (grey dot at 0 µM glycine). This step was conducted to optimise auto-focussing and detection of fluorescent objects in recorded fluomicrographs. Cells were perfused with NaI solution containing indicated lycine concentrations, whereupon a series of 5 images was recorded every 1.5 s. The lowest and highest fluorescence intensity, recorded in the first and fourth/fifth image is colored blue and red, respectively, with the intensities in intermediate images colored grey. B. Data filtering. Images of fluorescent cells always contained a substantial amount of debris (e.g. dead cells, cells expressing YFPI152L but not GlyRs or cells detaching during perfusion). To discriminate functionally relevant fluorescence signals from artefactual data, dose responses were filtered after automatic curve fitting. The histogram shows the average number (mean ± SD) of objects per image, averaged from 10 experiments, with 20 randomly selected wells per experiment before (black, cells & debris) and after filtering (striped, mainly cells) using either of the parameters EC50, slope (nH), R2 and ΔF as described in Methods. To achieve a maximal number of unbiased concentration responses all four parameters were combined for filtering (grey), resulting in approx. 50% of data points considered acceptable. C. Representation of normalized concentration-responses measured in a single well after filtering. In this example a total of 186 (grey) and 95 (black) cells were accepted and rejected, respectively. D. Scatter plot of EC50 and slope values derived from curves shown in panel C. ***P<0.0001 relative to untreated control, unpaired t-test.

