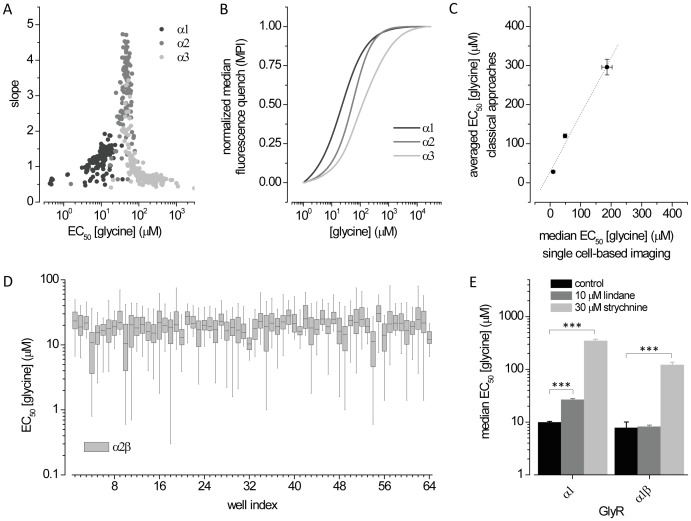
Figure 3. Quality control and proof-of-principle of the screening assay.
A. Dot plot of glycine EC50 and slope values obtained from dose-response experiments with cells expressing α1, α2 and α3 GlyRs conducted in individual wells. B. Averaged and normalized concentration-responses from the experiment depicted in A. C. Comparison of EC50 values from the experiment shown in panels A and B to data from whole-cell patch-clamp electrophysiology (Islam and Lynch, 2011). D. Box-plot of glycine EC50 in α2β GlyRs measured in 64 wells of a 384-well plate demonstrating the stability and usability of the assay for operation in high-throughput mode. Boxes and whiskers display the 25–75% and 5–95% data ranges, respectively, of all accepted values in each well. E. Drug-effects of 10 µM lindane (grey) and 30 µM strychnine (light grey) on α1 and α1β GlyRs, validating our assay for identification and characterization of chemicals modulating GlyRs. ***P<0.0001 relative to untreated control, unpaired t-test.

