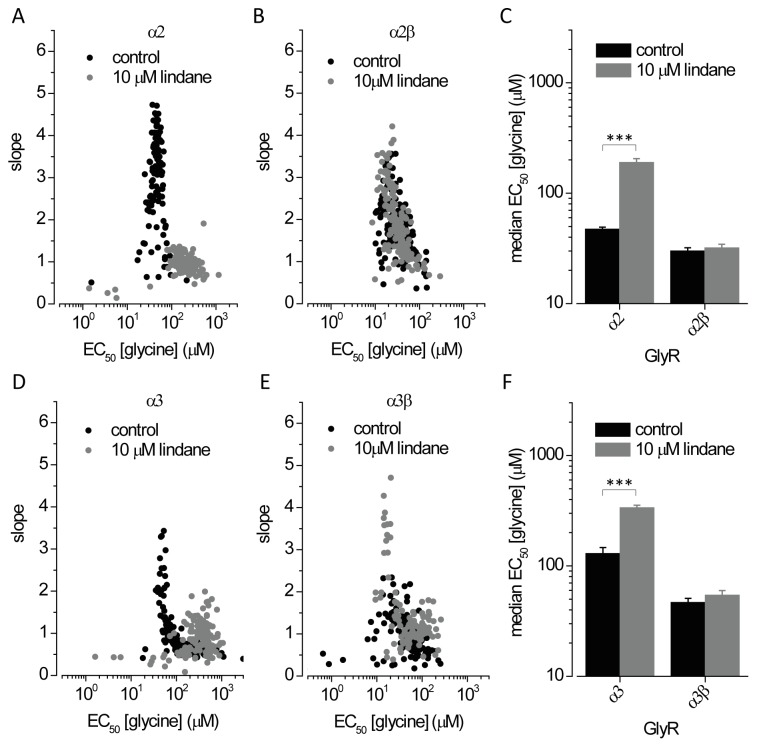
Figure 4. Effects of the lindane on α2, α3, α2β and α3β GlyRs as determined by fluorescence assay.
A, B, D, E. Dot plots of glycine EC50 and slope values in absence (black) and presence (grey) of 10 µM lindane measured in single cells expressing α2 and α2β (A–B) and α3 and α3β (D–E) GlyR. C, F. Histogram of median glycine EC50 (±SD) calculated from data shown in panels A, B (C) and D,E (F). These results provide evidence for lindane as a pharmacological tool for identifying the presence of β subunits in α2β and α3β heteromeric GlyRs. ***P<0.0001 relative to untreated control, unpaired t-test.

