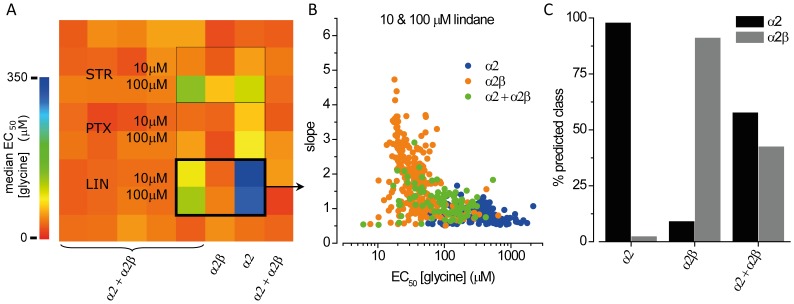
Figure 6. Clustering functional GlyR phenotypes in pure and heterogeneous cell populations.
A. Color map of mean glycine EC50 (µM) in presence and absence of the drugs strychnine, picrotoxin and lindane, as indicated. Warm and cold colors represent low and high EC50 values indicating no effect and inhibition, respectively. The black rectangle highlights experiments shown in B and C. B. Dot plot of glycine EC50 and slope values measured in presence of 10 and 100 µM lindane in pooled pure (α2, blue; α2β, orange) and mixed (α2+α2βgreen, 1∶1 ratio) cell populations from the experiment in A. Values measured in pure populations were used for training a J48 decision tree classification algorithm. C. Functional phenotyping of lindane-exposed GlyRs in pure (α2, blue; α2β, orange) and mixed (α2+α2β green) cell populations. Cells were classified according to their descriptors with a training set of 402 cells distributed in 2 classes: α2 (black), α2β (grey). Bars represent the percentage of cells assigned to either of the two classes and reflect the initial 1∶1 mixing ratio (green).

