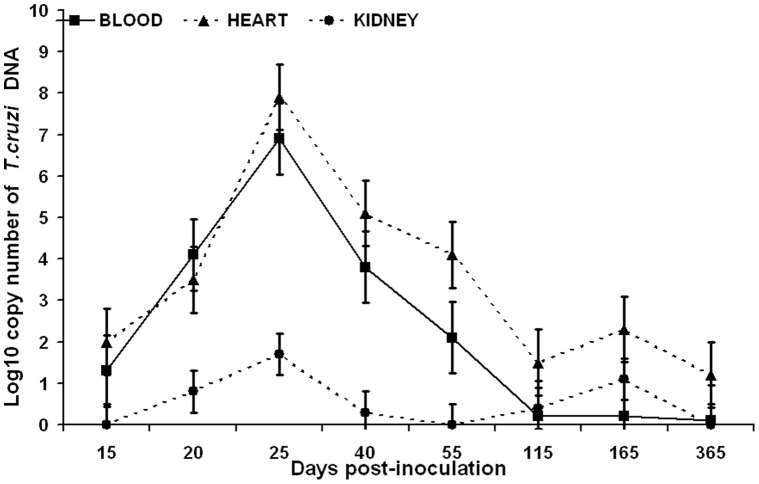
Figure 2. Levels of T. cruzi DNA in blood, heart and kidney during the course of infection.
Levels of copy number of T. cruzi DNA were detected by quantitative PCR. Values represent means and bars represent the standard deviation. Levels of DNA were calculated per ml and mg in blood and tissue, respectively. Eight animals were evaluated in each time point.

