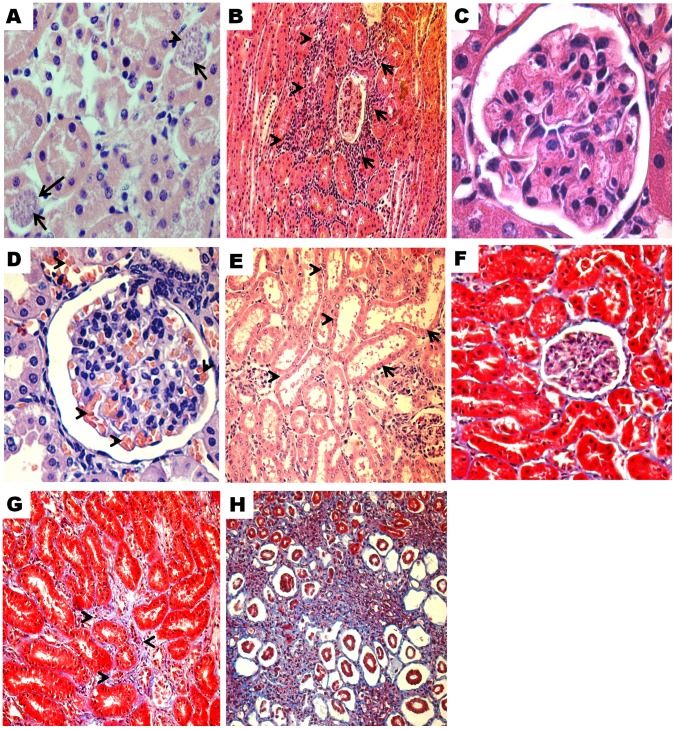
Figure 3. Histopathological changes in kidney tissue of guinea pigs infected with T. cruzi.
Hematoxylin-eosin stain: A). Amastigote nests (arrows) and tubular necrosis, 25 dpi (500x). B). Focal and mild periglomerular and interstitial inflammation (arrows), 25 dpi (100x). C). Glomerulus of non-infected guinea pig. Note the number of nucleus (1 to 3) in the mesangium (1000x). D). Mesangial hypercellularity and congestion (arrows), 365 dpi (400x). E). Dilatation of proximal tubules (arrows) and periglomerular inflammation, 40 dpi, (200x). Masson’s Trichromic stain: F). Kidney tissue of non-infected guinea pig (400x). G). Mild increase in interstitial collagen, 365 dpi (400x). H). Moderate increase in interstitial collagen and tubular atrophy, 25 dpi (200x).

