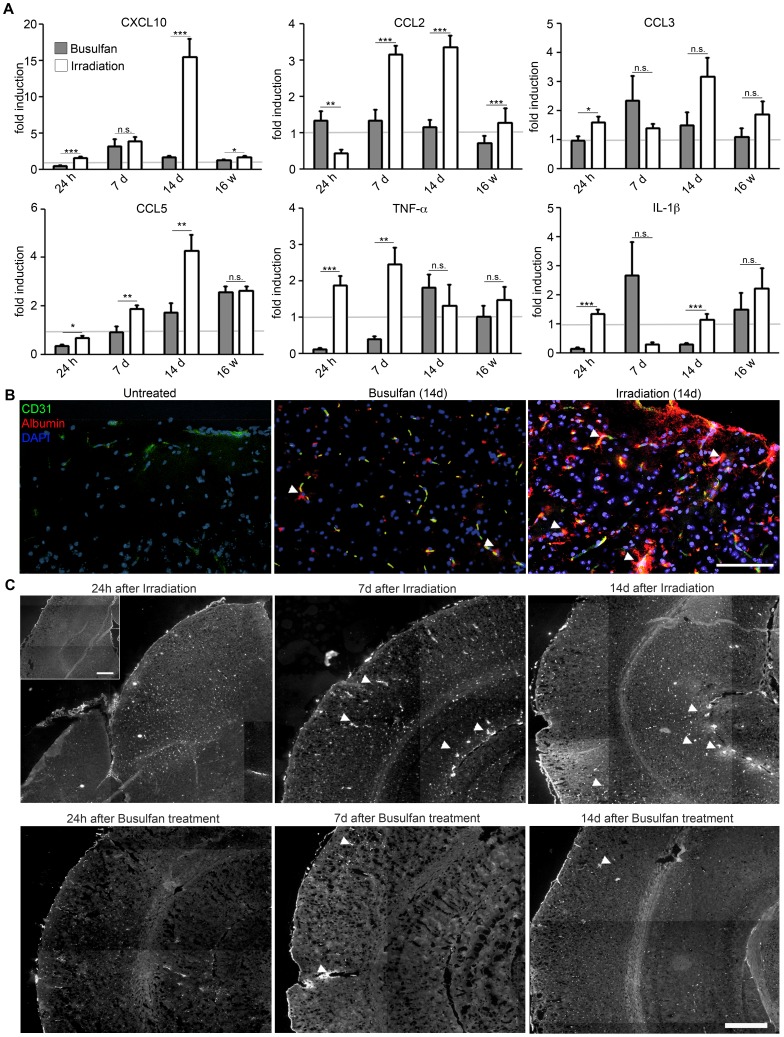
Figure 1. Reduced conditioning of the CNS after busulfan treatment.
A) Strongly diminished induction of proinflammatory cytokines and chemokines in busulfan-treated chimeras compared to irradiation protocols. Quantitative real-time PCR analysis of cytokine and chemokine induction in brains of busulfan-treated (grey columns) and whole-body irradiated (white columns) chimeras 24 hours (h), 7 days (d), 14 d and 16 weeks (w) after treatment. The mRNA expression was normalized to GAPDH and compared to untreated mice, indicated by the grey line. Data are shown as mean ± SEM. One out of two experiments is shown with three to six animals per group. Statistical significance is marked with asterisks (p<0.05 = *; p<0.01 = **; p<0.001 = ***). B) Largely preserved blood-brain-barrier (BBB) integrity after busulfan challenge. Direct fluorescence microscopic visualization depicting CD31+ endothelial cells (green), extravasal albumin (red) and nuclei (DAPI, blue). Arrow heads point to extravasated albumin. Representative pictures of cortices are shown. Scale bar = 100 µm. C) Albumin staining of the CNS parenchym is shown for both treated groups 24 hours (h), 7 days (d) and 14 d after treatment. Arrow heads point to extravasated albumin in superficial and deeper brain regions. Representative pictures are shown. Scale bar = 400 µm. Insert: Albumin staining of an untreated animal. Scale bar = 400 µm.

