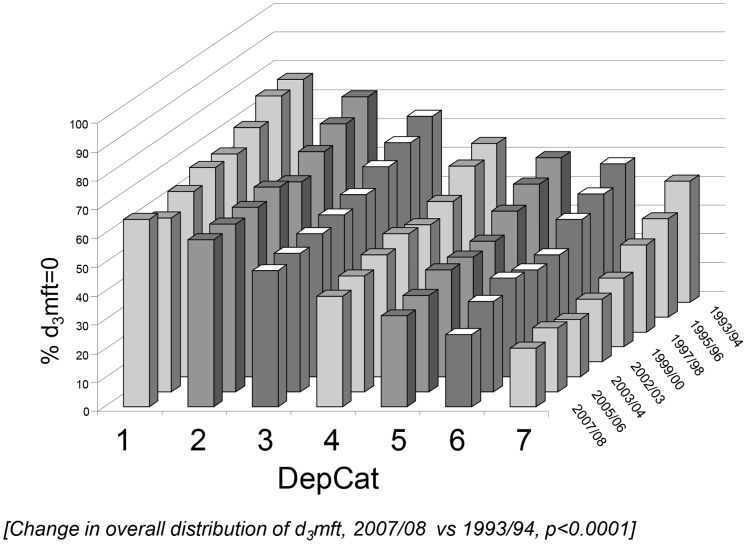
Figure 1. Prevalence of decayed, missing and filled teeth (%d3mft = 0) by SES for Scotland’s five-year-olds, 1993/94–2007/08.
Prevalence of decayed, missing and filled teeth (%d3mft = 0) by SES for Scotland’s five-year-olds, 1993/94–2007/08. (Change in overall distribution of d3mft, 2007/08 vs 1993/94, p<0.0001).

