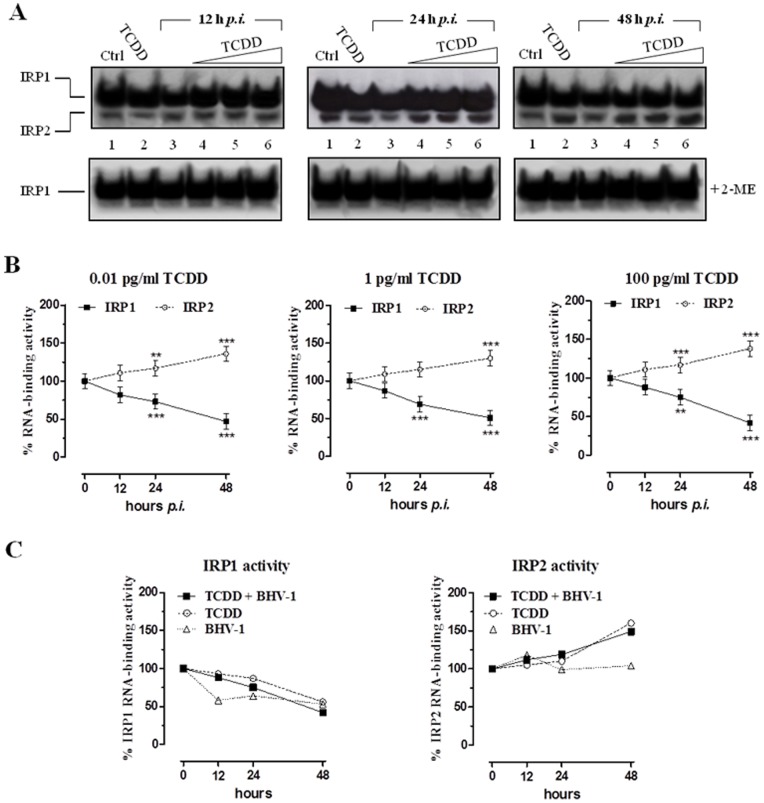
Figure 2. TCDD effect on Iron Regulatory Proteins activity.
(A) MDBK cells were treated with different concentrations of TCDD (0.01, 1, 100 pg/ml) for different times post-BHV-1 infection (12, 24 and 48 hours p.i.) at a MOI of 1, as indicated in lanes 4, 5, and 6 of each gel. Controls cells were treated with 100 pg/ml TCDD alone or infected with BHV-1 at a MOI of 1 (lanes 2 and 3, respectively, of each gel) for the indicated times (12, 24, and 48 h). Proteins were extracted and subjected to electrophoretic mobility-shift assay (EMSA). RNA band-shift assay was performed with 5 μg of cytoplasmic proteins and an excess of 32P-labeled IRE probe in absence (top) or presence (bottom) of 2% 2-ME. RNA-protein complexes were separated on non-denaturing 6% polyacrylamide gels and revealed by autoradiography. The autoradiograms shown are representative of four experiments. (B) IRP1-RNA and IRP2-RNA complexes were quantified by densitometric analysis and results of EMSA experiments performed without 2-ME were plotted in graphs as percent of the control and are the average ± SEM values of four independent experiments (solid line IRP-1; dotted line IRP-2). Graphs are distinctive depending by the indicated TCDD concentrations. ** p<0.01 compared with controls; *** p<0.001 compared with controls. (C) Comparison between the effects of BHV-1 infection and TCDD exposure, taken individually or in combination, on IRPs activity plotted in graphs as percent of untreated control cells and by means of the 100 pg/ml dose of TCDD and the MOI of 1 for BHV-1 infection.

