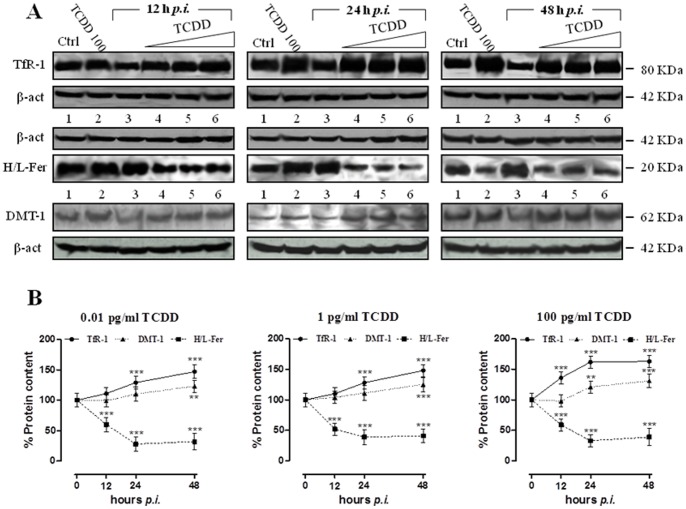
Figure 3. TCDD effect on iron regulatory proteins activity and expression in MDBK cells during BHV-1 infection.
(A) Western blot analysis showing the IRP1 and IRP2 protein content in MDBK cells incubated with different TCDD concentrations (0.01, 1, 100 pg/ml) for different times post-BHV-1 infection (12, 24 and 48 hours p.i.), as indicated in lanes 4, 5, and 6 of each blot. Controls cells were treated with 100 pg/ml TCDD alone or infected with BHV-1 at a MOI of 1 (lanes 2 and 3, respectively, of each blot) for the indicated times (12, 24, and 48 h). Shown are blots representative of four independent experiments. Equal amounts of proteins (100 µg) were separated on a 8% SDS – polyacrylamide gel and subjected to Western blot analysis using 1∶250 dilution of IRP1 and IRP2 antisera. (B) After chemoluminescence, the corresponding bands were quantified by densitometric analysis and plotted in graphs as percentage of control in relation to the used TCDD concentrations, as indicated. The anti-β-actin antibody was used to standardize the amounts of proteins in each lane. Shown are the average ± SEM values of four independent experiments (solid line IRP-1; dotted line IRP-2).

