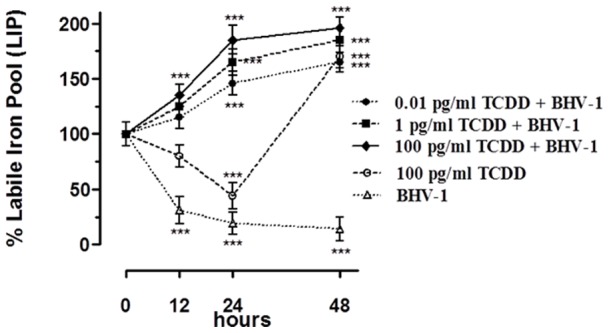
Figure 5. TCDD effect on Cellular Labile Iron pool in MDBK cells after BHV-1 infection.

LIP extent variations in MDBK cells incubated with different TCDD concentrations (0.01, 1, 100 pg/ml) for 12, 24 and 48 hours, and/or infected with BHV-1 at a MOI of 1, estimated with the CA fluorescent method. Cell cultures were loaded with CA using acetomethoxyl-calcein, and fluorescence was measured before and after the addition of 100 mM permeant iron chelator SIH. Shown are the average ± SEM (n = 6) values of three independent experiments plotted in a graph as percent of control untreated cultures. *** p<0.001 vs control cells.
