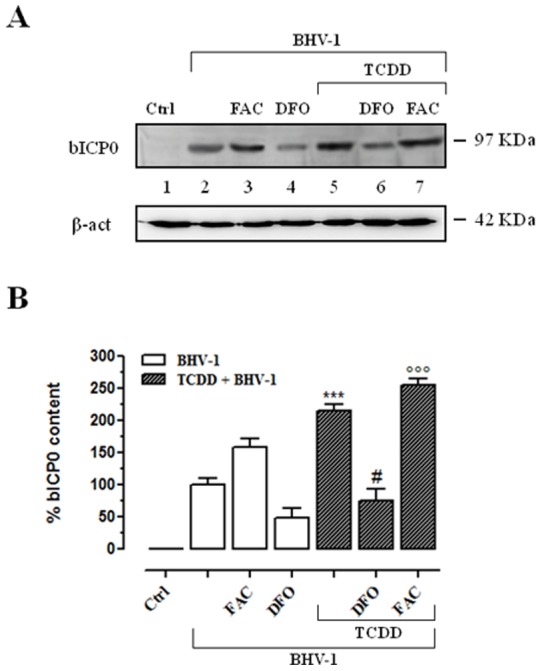
Figure 8. Effect of iron repletion-depletion on bICP0 protein levels.

(A) Western blot analysis showing the bICP0 content in iron deplete-replete MDBK cells at 48 h post-BHV-1 infection (MOI of 1), in presence or not of 1 pg/ml of TCDD, as indicated in the legend. In iron depletion – repletion experiments, cells were treated with 100 μM desferrioxamine (DFO) or with 50 μg/ml ferric ammonium citrate (FAC). Equal amounts of cytosolic lysates containing 100 μg of proteins were fractionated by 12% SDS-PAGE and subjected to Western blot analysis using 1∶800 dilution of bICP0 polyclonal rabbit antiserum. The anti-β-actin antibody was used to standardize the amounts of proteins in each lane. Shown is a blot representative of four independent experiments. (B) bICP0 protein bands detected by chemoluminescence were quantified by densitometric analysis and plotted in bar graphs as percentage of control (open bars for iron deplete-replete BHV-1 infected cells, filled bars for iron deplete-replete BHV-1 infected cells exposed to TCDD, as indicated in the legend). Shown are the average ± SEM values of four independent experiments. *** p<0.001 vs BHV-1 infected cells; # p<0.1 vs iron depleted BHV-1 infected cells; °°° p<0.001 vs iron repleted BHV-1 infected cells.
