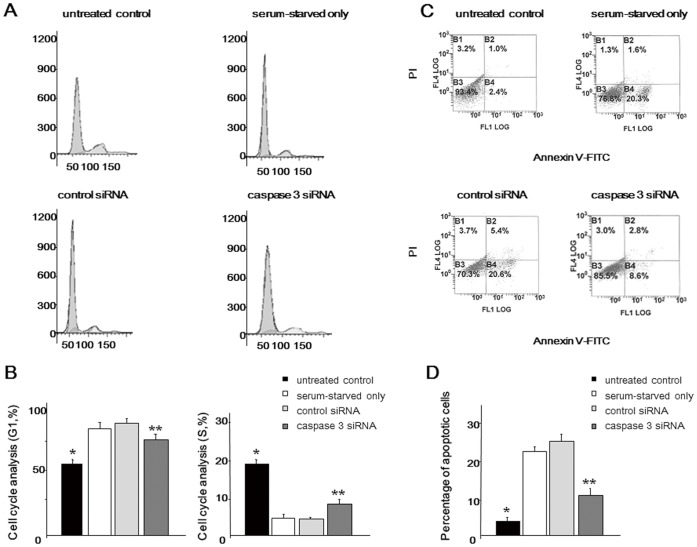
Figure 4. Flow cytometric analysis of rat nucleus pulposus (NP) cells. Forty-eight hours after caspase 3 siRNA transfection, cells were serum-deprived and harvested after 48 h.
(A) Representative graphs showing the cell cycle. (B) Comparison of the cell cycle in the G1 and S phase. (C) The dual parametric dot plots combining annexin V-FITC and PI fluorescence show the early apoptotic cells (FITC+/PI -), and the late apoptotic cells (FITC+/PI +). (D) Percentage of (early+late) apoptotic cells. Results are representative of three independent experiments. Values are expressed as the mean ± SD (* = P<0.05 versus all other groups, ** = P<0.05 versus serum-starved only and control siRNA).

