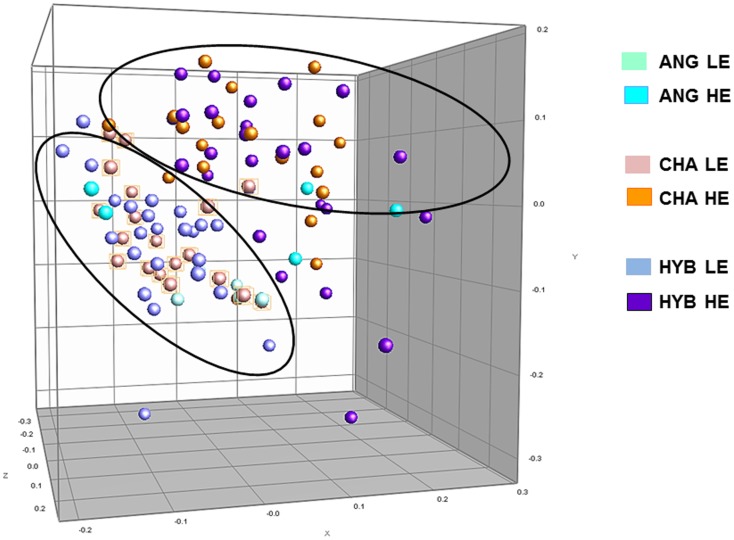
Figure 1. Multidimensional Scaling Analysis of the bacterial profiles generated from the rumen fluid of 49 steers, progeny of ANG, CHA or HYB sires.
DNA from forty-nine steers fed low energy (LE) density diet and then switched to high energy (HE) density diet, was amplified using primers HDA1-GC and HDA2 (22 to 55% DGGE). Colours represent a particular sire breed: light blue, ANG fed LE diet; cyan blue, ANG fed HE diet; light pink, CHA fed LE diet; orange, CHA fed HE diet; azure blue, HYB fed LE diet, and purple, HYB fed HE diet. The comparison of the PCR-DGGE profiles was generated with the Bionumerics software package using UPGMA (unweighted pair-group) method as described in the text; comparison was optimised upon calculation of the best values for tolerance.

