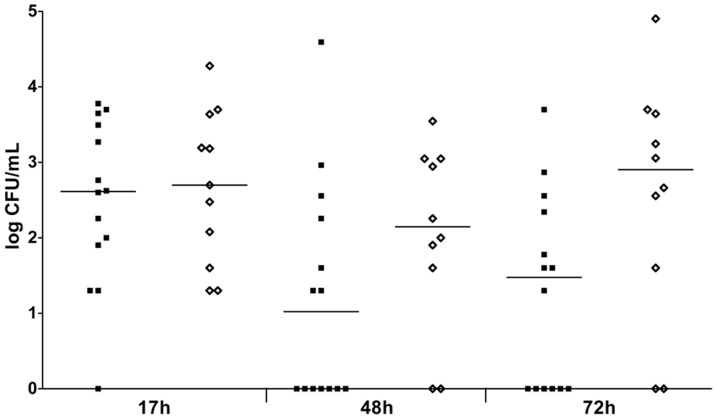
Figure 4. S. aureus counts in blood from mice with bacteremia at indicated time points.
Mice were inoculated intravenously with S. aureus at the LD50 inoculum (n = 25). Each symbol represents a single mouse. Median values are indicated by horizontal lines. Surviving infected mice (▪), non-surviving infected mice (⋄). Statistically significant differences in numbers of animals with positive blood cultures (Fisher exact test) or S. aureus counts (Mann-Whitney U test) between groups of surviving infected mice versus non-surviving infected mice were never observed. h, hours.

