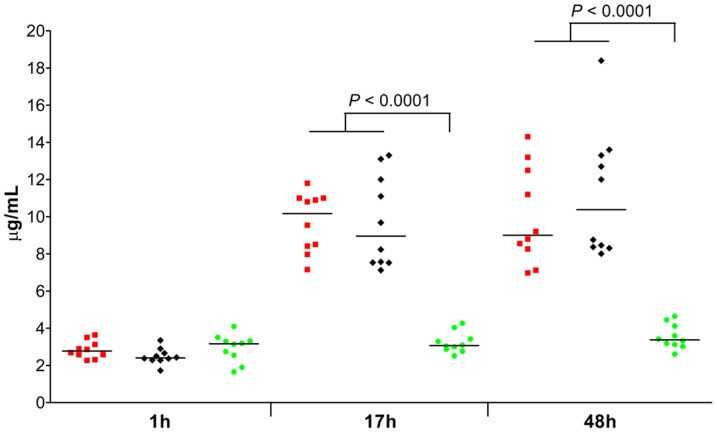
Figure 5. Serum C-reactive protein (CRP) levels in mice with S. aureus bacteremia at indicated time points.
Mice were inoculated intravenously with S. aureus at the LD50 inoculum. Each symbol represents a single mouse. Red squares represent surviving infected mice (n = 10); black diamonds represent non-surviving infected mice (n = 10); green circles represent placebo-inoculated mice (n = 10). Median values are presented by horizontal lines. Statistically significant differences between infected mice and placebo-inoculated mice are indicated. Statistically significant differences were never found between surviving infected mice and non-surviving infected mice. P-values < 0.01 (Mann-Whitney U test) are shown. h, hours.

