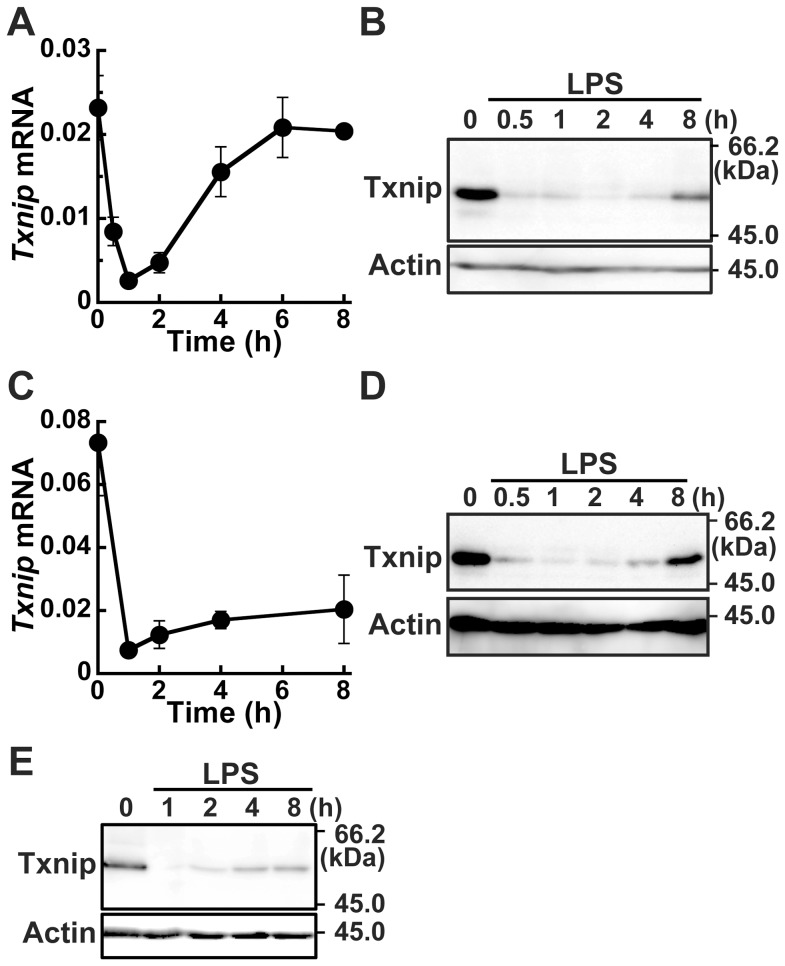
Figure 1. Suppression of Txnip expression by LPS.
RAW264.7 cells (A and B), BMDM (C and D), or differentiated THP-1 cells (E) were stimulated with 100 ng/ml LPS. Cells were lysed at the indicated time after stimulation. Txnip mRNA copy numbers normalized to that of β-actin are shown (A and C). Data shown are mean ± S.E. of at least 4 independent experiments. Txnip and β-actin proteins were detected by western blotting (B, D, and E). Data shown are a representative of at least three independent experiments.

