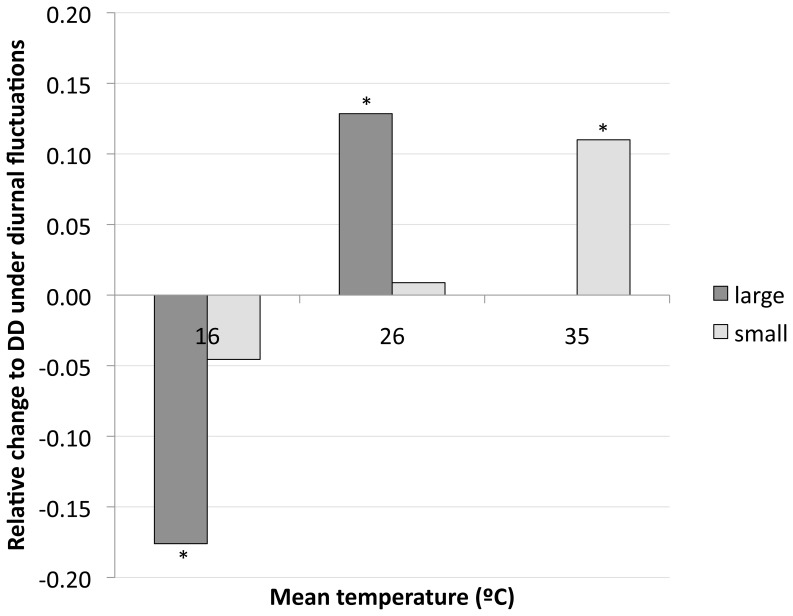
Figure 4. Relative changes in the degree-days required for larval development under constant and fluctuating temperatures.
Zero on the y-axis represents the estimated degree-days for constant temperature development, with the bars in either direction indicating the relative change in degree-days needed by mosquitoes under respective fluctuating temperature treatments to reach pupation. Asterisks indicate that the change is significantly different to the constant temperature control (p<0.01).

