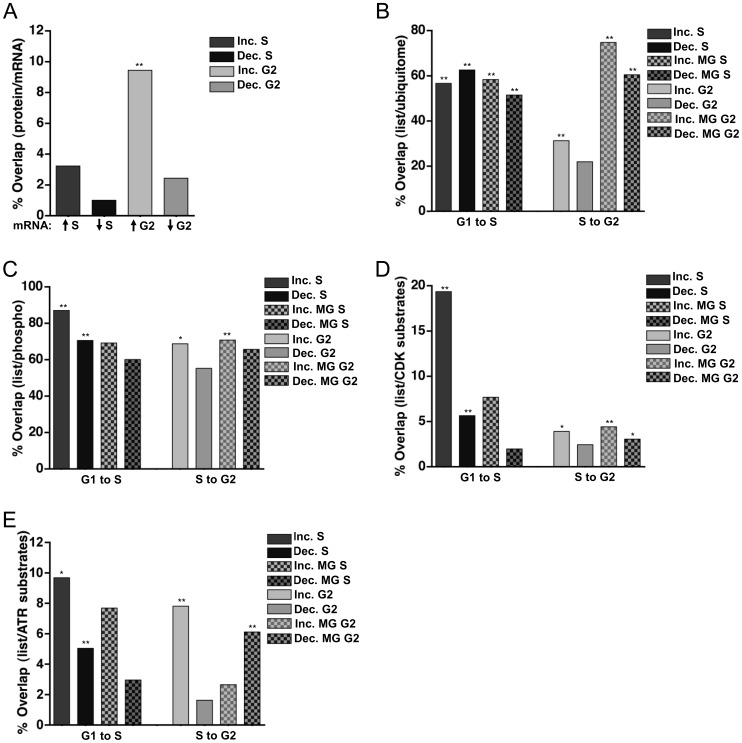
Figure 4. Discordance between mRNA and protein abundance.
A) Individual lists of proteins that changed by at least 1.5-fold were compared to the mRNA data for those same proteins in synchronized HeLa cells from Whitfield et al. 2002 [7]. The percentage of proteins whose corresponding mRNA also changed is graphed for both S phase and G2 phase. ** p<0.001. B-E) Individual lists of proteins that changed by at least 1.5-fold were compared to proteins predicted to be B) ubiquitinated in asynchronous HCT116 cells [15], C) phosphorylated in HeLa cells [8], D) substrates of Cyclin A/Cdk2 [17], and E) substrates of the ATR kinase [16]. The percentage of each list that overlaps with the published dataset is plotted. * p<0.01; ** p<0.001.

