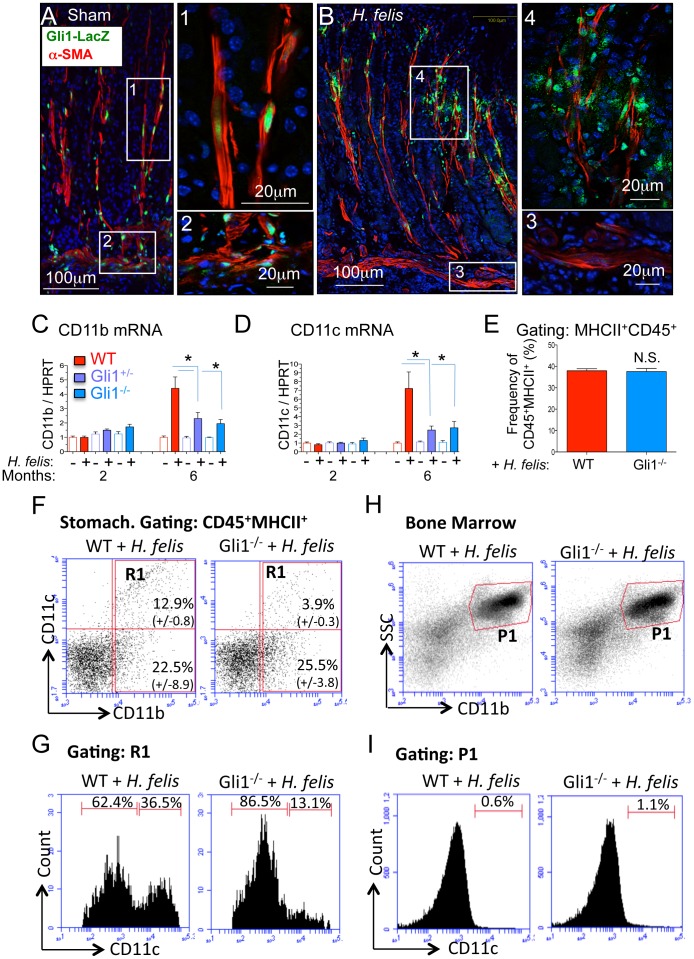
Figure 3. Gli1 deletion prevents expansion of CD11b+CD11c+ myeloid cell subsets.
A–B) Immunofluorescent detection of β-gal (green), α-SMA (red), and DAPI (blue) in sham- and H. felis-infected Gli1+/LacZ mice. C–D) RT-qPCR analysis of CD11b and CD11c in 2- and 6-month infected mice. E) Bar graphs representing the percentages of CD45+MHCII+ myeloid cells per total gastric cell number in 6-month H. felis-infected WT versus Gli1−/− mice. F) Flow cytometric analysis of CD11b and CD11c in 6-month infected WT and Gli1−/− mice. Values on dot plot represent the percentages of cells (relative to total CD45+MHCII+ myeloid cell population) +/− SEM from N = 3 mice per group. G) Flow cytometry of CD11c+ cells within the CD11b+ stomach population (R1 gate from Figure 3F) of 6-month H. felis-infected WT versus Gli1−/− mice. H) Flow cytometric analysis of CD11b+ bone marrow cells in 6-month H. felis-infected WT and Gli1−/− mice. I) Flow cytometry of CD11c+ cells within the CD11b+ bone marrow population (P1 gate from Figure 3H) of 6-month H. felis-infected WT and Gli1−/− mice. Open and closed bars denote uninfected and infected mice respectively. Error bars represent the mean +/− SEM. For RT-qPCR graphs, N = 5–10 mice per group. For flow sorting bar graph, N = 3 mice per group. Values on flow cytometric dot blots represent the mean +/− SEM from 3 mice per group. *p<0.05.

