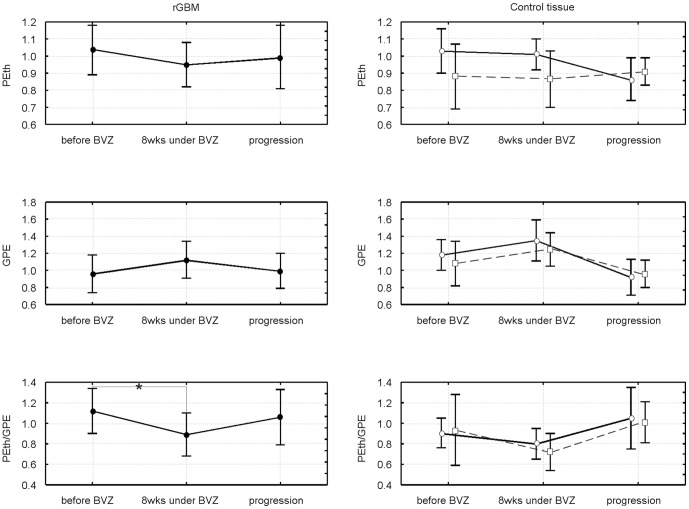
Figure 5. Longitudinal changes in ethanolamine metabolites for tumor and control tissue.
The upper rows show concentrations, the lower row the respective concentration ratios. For controls both ROIs (see Material and Methods) are shown with open symbols, the contralateral region with circles and solid lines, the temporal region (depicting ROI in the temporal region independent from tumor position) with squares and dashed lines. The data represent a subgroup with at least 110 days of progression free survival including patients with long-OS and short-OS (please note that 4 patients with long-OS still not had tumor progression).

