
Figure 6. Longitudinal changes of high energy phosphate metabolite concentration.
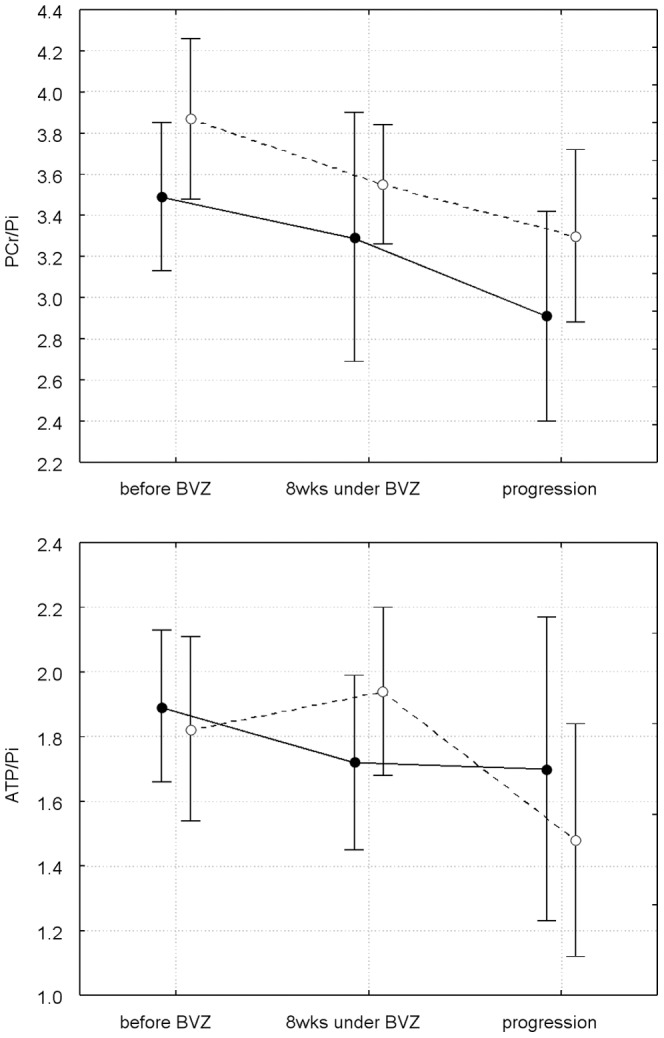
Closed represent tumor, open signals control tissue. Values for the first two time points are different from Table 1, since the data represent a different subgroup (6 patients from the short-OS group, 7 patients from the long-OS group). All patients included in this figure had no confirmed tumor progression at the second time point and could be examined until tumor progression.