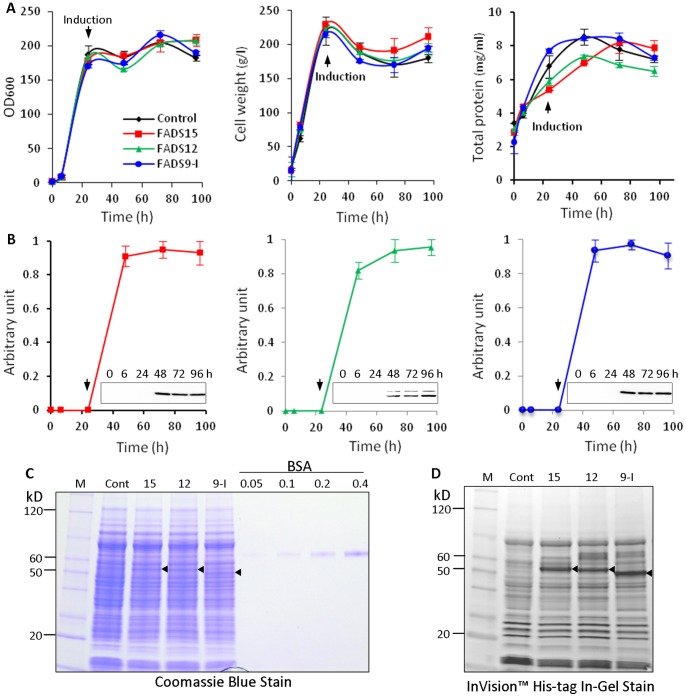
Figure 1. Expression of recombinant FADS.
(A) Growth curve of the recombinant P.pastoris measured by cell density, wet weight and total protein concentration. (B) Kinetics of recombinant protein induction. Desaturase expression was determined by Western blotting using anti-His tag antibody. The normalized level of highest expression was set at one arbitrary unit. Three independent experiments were performed and bars represent standard deviations. (C) Quantification of the recombinant desaturase proteins by Coomassie blue staining after SDS-PAGE. Known concentrations of BSA were used as quantification standard. (D) InVision™ His-tag In-Gel Stain of recombinant FADS proteins. The arrow head indicates the addition of methanol for induction of recombinant protein expression. The triangles indicate the expressed recombinant proteins. M: protein marker, Cont: negative control which was PichiaPink™ harboring pPinkα-HC, 15: FADS15, 12: FADS12, 9-I: FADS9-I.

