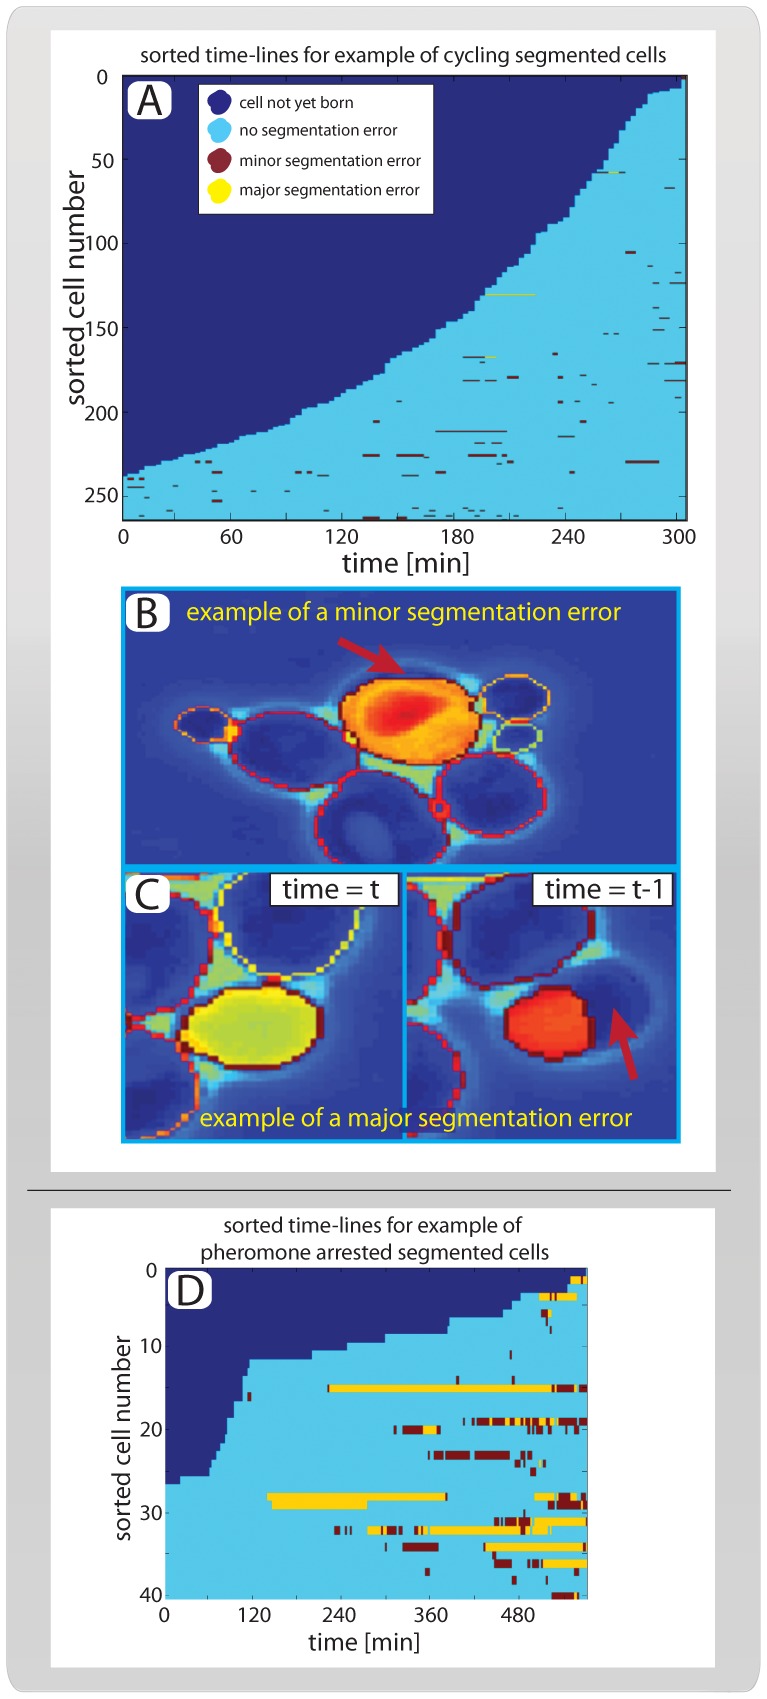
Figure 5. Performance.
(A) Sorted cell traces for 263 example cells. All cells are present at the first (tmax = 300 min) segmented time point because the tracking and segmentation runs backwards in time. (B) Example of a minor segmentation error is indicated by the red arrow. Note that these errors are identified manually and represent cells whose area is segmented between 90% and 95% correctly. (C) Example of a major segmentation error, corresponding to a cell whose area is segmented less than 90% correctly as shown in the right panel. Note that the vast majority of major segmentation errors stem from unexpected cell movement. As seen here, the erroneously segmented cell moves significantly between the frames shown in the left and right panels. (D) Sorted cell traces for cells arrested in mating pheromone, colors indicate segmentation errors as in ‘A’.

