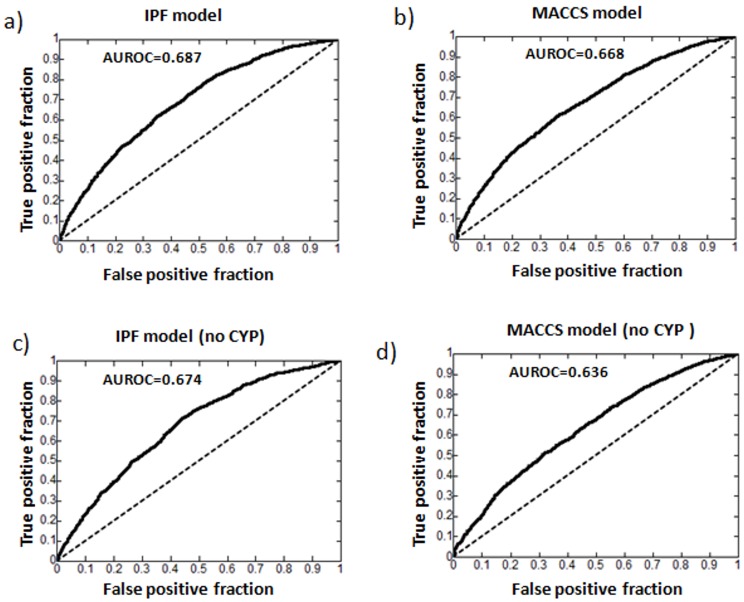
Figure 4. ROC curves for test set D: a) ROC curve generated by the IPF model for test set D.
Interactions for the top 50 drugs (41 generic names) confirmed in drugs.com/drugdex were considered as true positives within all the possible interactions in a matrix of 41×928 drugs. Interactions already in the initial DrugBank DDI database (matrix M1) were not included in the analysis; b) ROC showed by a model applied to test D using MACCS fingerprints; c) ROC curve calculated by the IPF model for test set D but excluding CYP interactions; d) ROC showed by the MACCS fingerprints model applied to the test D without CYP interactions.

