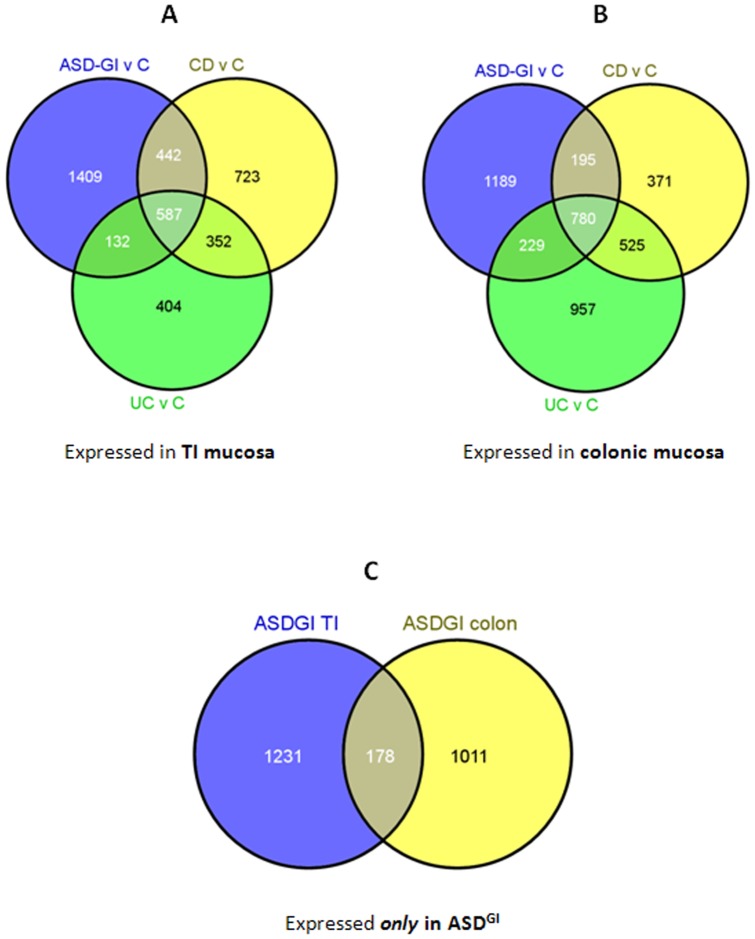
Figure 4. Overlapping unique ASDGI gene expression from TI and colon.
Pair-wise comparisons were performed between each of the disease groups (ASDGI, CD and UC) and the control (non-histopathologic tissue) samples. A. There were 1409 unique DETs (differentially-expressed transcripts) in the ASDGI versus control comparison in TI mucosa. B. There were 1189 unique DETs in the ASDGI versus control comparison in colonic mucosa. C. The overlap between those two lists is displayed in this Venn diagram. There are a total of 178 DETs shared in ASDGI tissues (Table S4 ). This list of 178 DETs was imported into Ingenuity Pathway Analysis software for further analysis.

