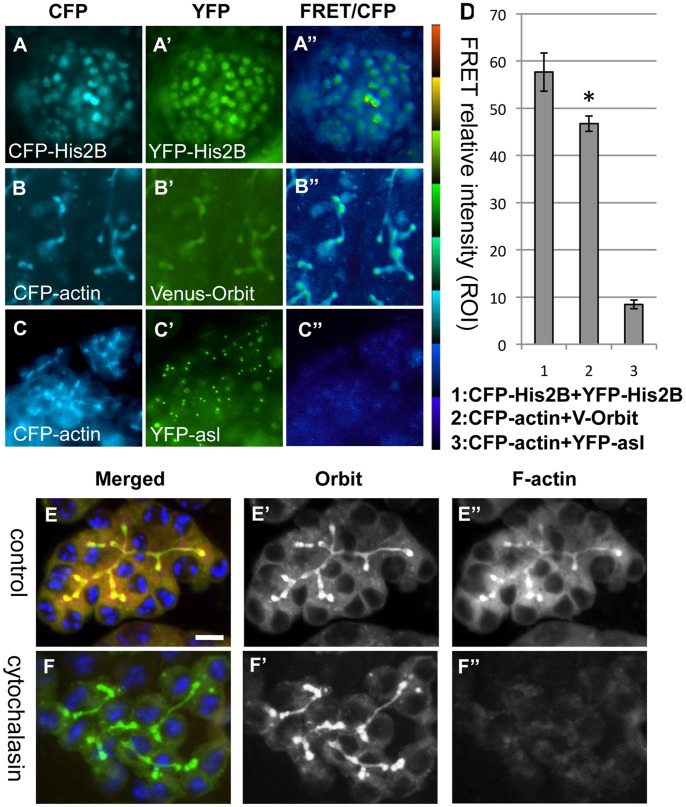
Figure 3. Close association of Orbit with F-actin contained in a fusome of a spermatocyte cyst.
(A–C″) CFP and YFP fluorescence images, and fluorescence resonance energy transfer (FRET)/CFP emission ratio images in spermatocytes. (A–A″) Positive control for FRET experiment in early spermatocytes. Co-expression of CFP-histone 2B (A) to YFP-histone 2B (A′) was induced in early spermatocytes using the UAS/Gal4 system. (A″) A FRET/CFP emission ratio was calculated using MetaMorph software. The distribution of the ratio between the minimum value (darkest blue) and maximum value (lightest red) is represented by the 8-step color indicator in the intensity-modulated display mode. Note the distinct YFP emission in nuclei of early spermatocytes after CFP excitation. It is well known that histone H2B forms a dimer in a nucleosome, and therefore, the YFP emission is generated because of FRET from CFP to YFP. (B–B″) CFP and FRET/CFP ratio images of spermatocytes with co-expression of Venus-Orbit and CFP-actin. CFP (B) and FRET/CFP ratio images (B″) of spermatocytes with co-expression of Venus-Orbit and CFP-actin. (C–C″) A spermatocyte with co-expression of CFP-actin (C) and YFP-Asl (C′), as a negative control for the FRET experiment. (D) The average FRET relative intensity in nuclei of spermatocytes with co-expression of CFP-Histone 2B and YFP-Histone 2B, fusomes of spermatocytes with co-expression of CFP-actin and Venus-Orbit, and fusomes in spermatocytes with co-expression of CFP-actin and YFP-Asl. The FRET relative intensity was calculated and represented according to [44]. (E) F-actin and Orbit are components of fusomes extending in a spermatocyte cyst. RFP-actin (red), GFP-Orbit (green), and DNA (blue) are shown. (F) F-actin depolymerization induced by treatment with cytochalasin D does not influence Orbit localization on fusomes, or maintenance of the fusome structure. Scale bar = 10 µm.

