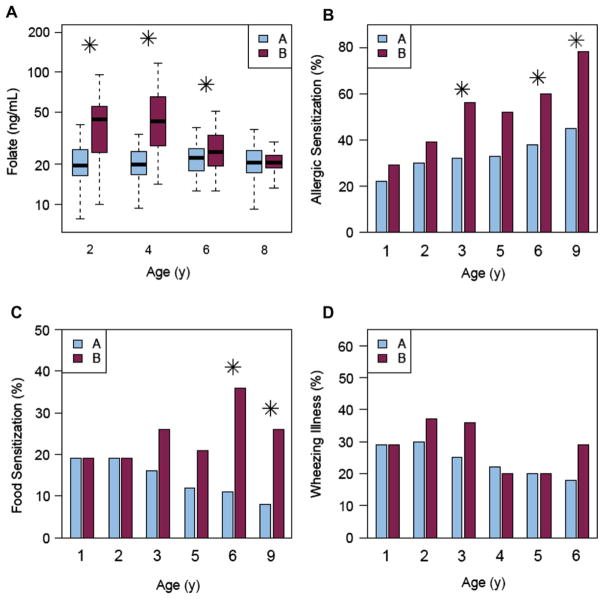
FIG 1.
A, Model-based clustering identification of 2 clusters of participants on the basis of the temporal pattern of their folate levels. Cluster A shown in blue and cluster B shown in red. B, Rates of allergen sensitization in cluster A versus cluster B. C, Rates of food sensitization in cluster A versus cluster B. D, Wheezing illness in cluster A versus cluster B.

