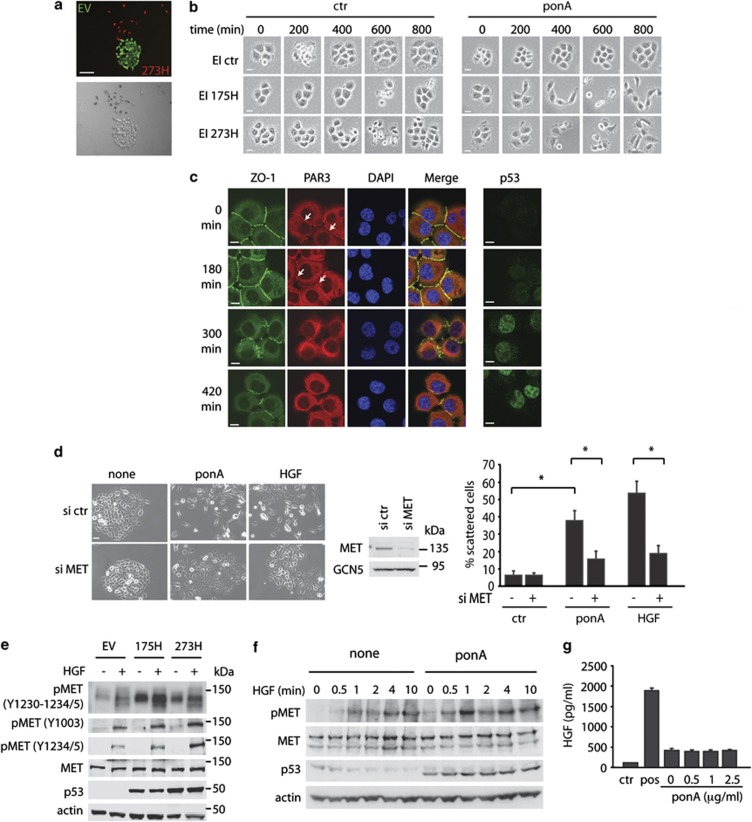
Figure 1.
Mutant p53 enhances MET signalling to drive scattering. (a) Merged red and green channel microscope images and bright field images of control (EV) and mutant p53 (273H) H1299 cells tagged with, respectively, GFP or Cherry. Scale bars indicate 50 μm. (b) EI H1299 cells expressing a vector (ctr) or mutant p53 (175H or 273H) were allowed to form discrete colonies. A total of 2.5 μg/ml ponA was then added to the cells and scattering was monitored using time lapse microscopy. Scale bars indicate 20 μm. (c) Immunostaining for ZO-1, PAR3, DAPI and a merge (left panels) or p53 (right panels) in EI 175H cells after ponA induction. Scale bars indicate 10 μm. Arrows indicate PAR3 staining in the cell–cell junctions. (d) EI 175H cells were transfected with MET siRNA and after 16 h induced with ponA or HGF for 48 h and analysed for scattering (left panels, quantification right panels). Knockdown of MET was verified using immunoblot analysis for MET expression (middle panel) with GCN5 as loading control. Scale bars indicate 50 μm. * indicates statistical significant changes (P<0.05) as determined by a T-test. (e) Mutant p53 (175H or 273H) or control (EV) H1299 cells were analysed for MET expression and MET phosphorylation as assessed by western blot using different pMET antibodies with or without 10 min HGF stimulation. Total MET and actin were used as loading control. (f) Immunoblot analysis showing MET phosphorylation in EI 175H H1299 cells uninduced (none) or induced to express mutant p53 (ponA), incubated with HGF for 0.5, 1, 2, 4 or 10 min. Actin and total MET expression were used as loading controls. (g) ELISA measurement of HGF excretion in the medium of ponA-treated EI 175H cells. Ctr indicates medium that has not been exposed to cells. Pos indicates a positive HGF lysate as included in the ELISA kit.

