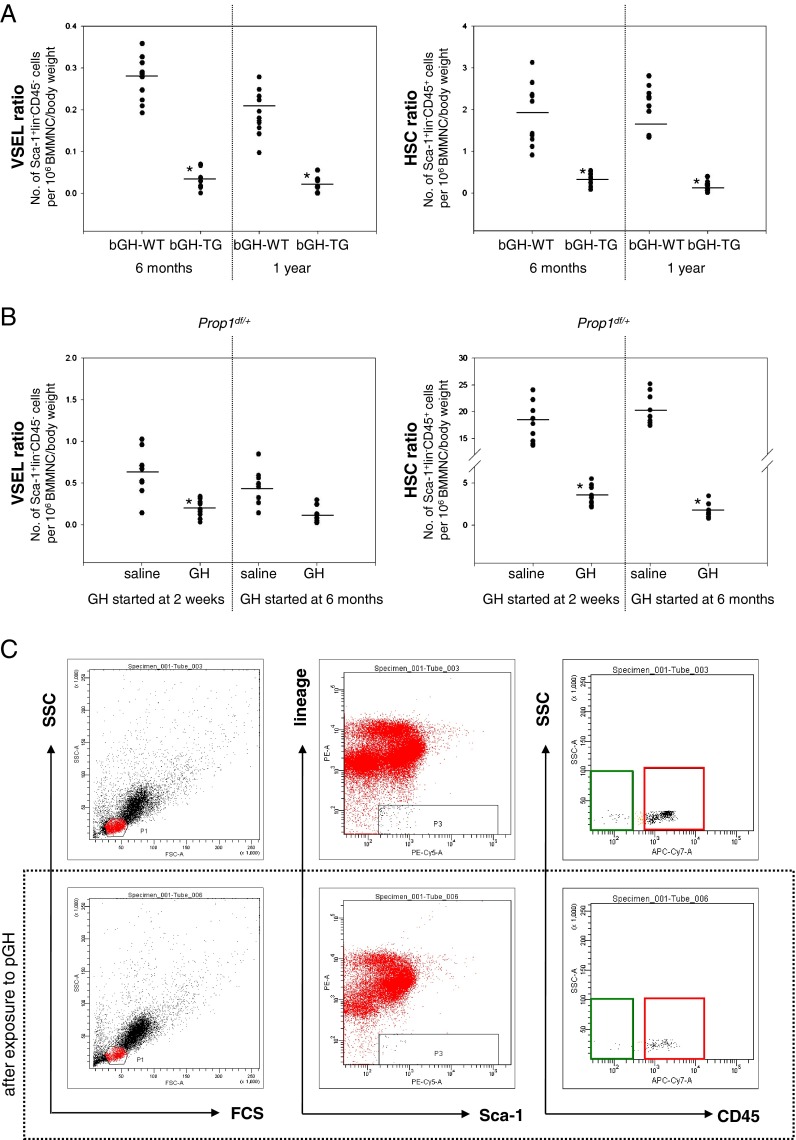
Fig. 1.
Reduced numbers of VSELs and HSPCs in BM of mice with elevated plasma GH and IGF-I levels. a Decreases in the number of VSELs (left) and HSCs (right) in 6-month-old and 1-year-old bGH transgenic mice. The numbers of Sca-1+Lin–CD45– (VSELs) and Sca-1+Lin–CD45+ (HSCs) were evaluated as the number of events per 1 × 10⁶ BMMNC/body weight using the LSR II BD FACS analyzer with FACSDiva™ software. Analysis of variance (ANOVA) with Bonferroni's multiple comparison test (*p < 0.00001) with comparison to normal counterparts was performed. b Reduced numbers of VSELs (left) and HSCs (right) after injections of wild-type mice with porcine GH (pGH). The numbers of Sca-1+LinCD45– (VSELs) and Sca-1+LinCD45+ (HSCs) were evaluated as in a. ANOVA with Bonferroni's multiple comparison test (*p < 0.00001) with comparison to normal counterparts was performed. c Analysis of Sca-1+Lin–CD45– (VSELs) and Sca-1+Lin–CD45+ (HSCs) from mBM-derived MNCs using the LSR II BD FACS analyzer with FACSDiva™ software. BMMNCs from region P1 were analyzed for Sca-1 and Lin expression. The Sca-1+Lin– population, which is included in region P3, was subsequently analyzed based on CD45 antigen expression, and the CD45– and CD45+ subpopulations were visualized by dot plot: Sca-1+Lin–CD45– (VSELs, green area) and Sca-1+Lin–CD45+ (HSCs, red area). Lower panel decrease in the numbers of VSELs and HSCs after GH administration (6 μg/g/day) compared to animals treated with saline (upper panel, control group)

