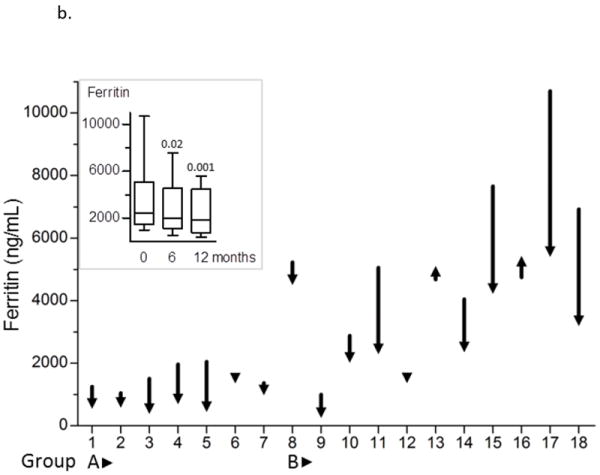
Figure 2. Improvement in systemic iron burden with combined chelation therapy.


The magnitude of change in LIC (a) and ferritin (b) over 12 months is shown as decrease or increase in the measured value compared with baseline for each subject. The inset graph shows group medians and range. P values evaluate the significance of improvement in LIC at 6 months and 12 months.
