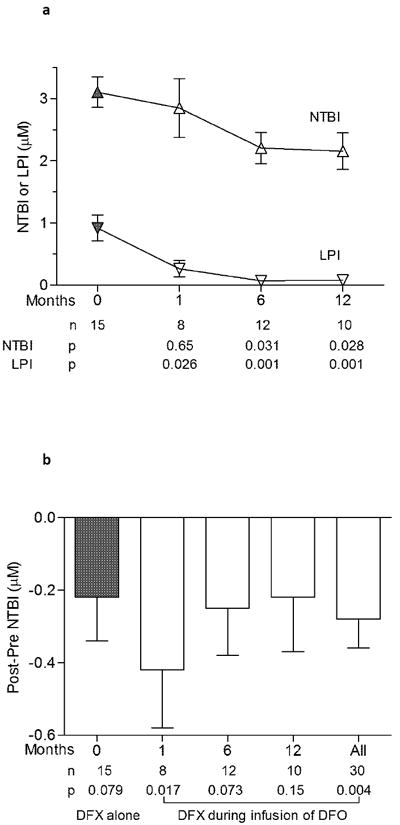
Figure 3. Control of plasma NTBI and LPI with combined chelation therapy.

Trend in NTBI and LPI over 12 months is shown in figure 3a. Symbols represent means and standard error at 4 different visits. The baseline sample (solid symbols) was obtained 72 hours after stopping all chelation. Later samples (open symbols) were obtained 24 hours from the previous dose of DFX while infusing DFO. P values evaluate the significance of difference from baseline. The effect of DFX on NTBI in presence of DFO is shown in figure 3b. A decrease in NTBI was observed when DFX was administered alone (time 0) or during infusion of DFO (time 1, 6 and 12 months). Samples were drawn before and 2 hours following administration of DFX. P values evaluate the difference (post-pre) at each time point.
