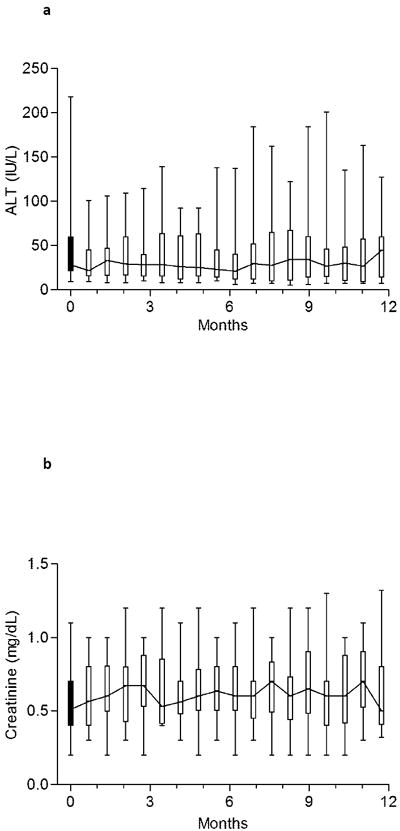
Figure 4. Monitoring for hepatic and renal toxicity.

Median and range of alanine aminotransferase (a) and creatinine (b) at baseline and during study. The trend line connects the medians. Each time-point represents between 13-22 observations.

Median and range of alanine aminotransferase (a) and creatinine (b) at baseline and during study. The trend line connects the medians. Each time-point represents between 13-22 observations.