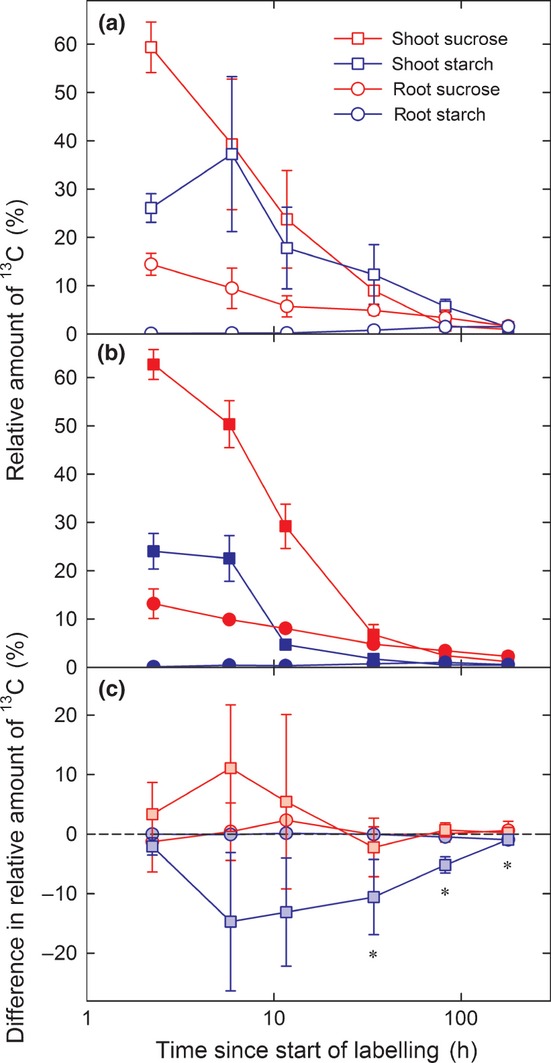
Fig. 4.

Relative amount of tracer 13C pools in shoot and root sucrose and starch in (a) unshaded (open symbols) and (b) shaded (closed symbols) plots of a mountain meadow, and (c) the difference in the respective relative pool sizes of shaded minus unshaded plots. The amounts of 13C in the respective pools are expressed as a fraction (%) of the total amount of 13C recovered in all of these carbohydrate pools at the first sampling (2 h after the start of labeling and immediately before the start of the shading experiment). Error bars signify ± SE. *, Values for shoot starch are significantly (P < 0.05) different from zero. The partitioning of pools is based on the assumption that biomass and root/shoot ratios remained constant during the week of shading.
