
Figure 5.
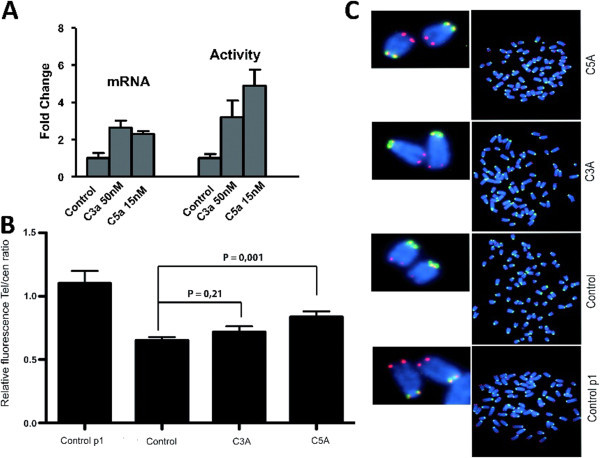
Telomerase analysis.A) Telomerase mRNA expression and TRAP activity in CPCs cultured in presence of C3a or C5a. B and C) CPCs cultured in presence of C5a and C3a present longer telomeres than their counterparts. B) Quantification of relative fluorescence of telomere vs. centromere FISH probe Three independent experiments was analyzed. p ≤ 0.05 (*); p ≤ 0.01 (**). C) Representative figures of chromosome FISH. Centromere (red) Telomere (green).