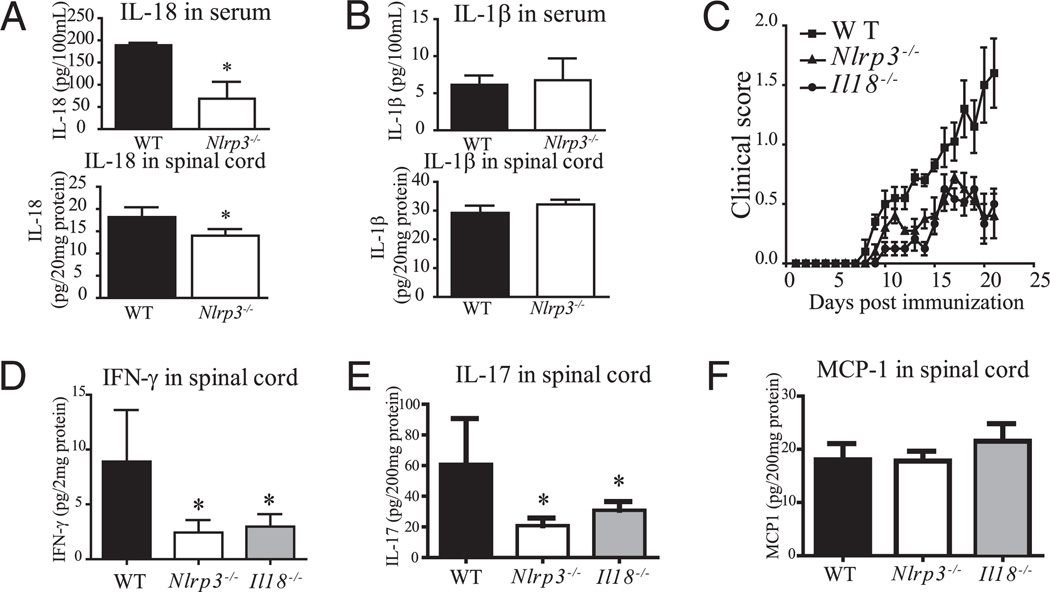
FIGURE 6.
IL-18 levels are reduced in Nlrp3−/− mice in the EAE model. A, Levels of serum and spinal cord IL-18 in WT and Nlrp3−/− mice. B, Same as A, except for levels of IL-1β. C, Progression of EAE in WT, Il18−/−, and Nlrp3−/− mice. D, IFN-γ in the spinal cords 3 wk after immunization. E, IL-17 in the spinal cords 3 wk after immunization. F, MCP-1 in the spinal cords 3 wk after immunization. Data are shown as a mean ± SD of n = 5. *p < 0.05; Student t test; statistically significant difference relative to controls.

