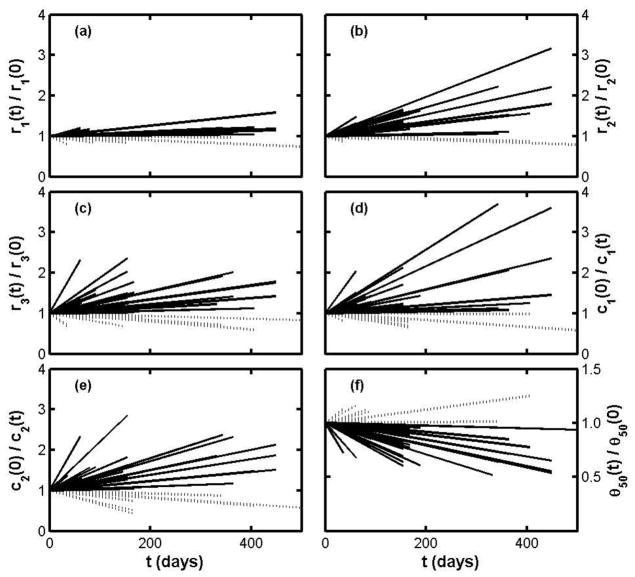
Figure 4.
Figure 4(a–e). Test-retest results for ALS patients plotted as parameter ratios over time, without distinction between clinically affected and relatively spared muscles. Subplot (f) shows the time dependence of the 50 kHz phase. In all the subplots solid lines indicate increasing severity and dashed lines indicate stable or decreasing severity.

